


فريقنا لديه أكثر من 7,000,000 من التجار!
كل يوم نعمل معا لتحسين التداول. نحصل على نتائج عالية ونمضي قدما.
الاعتراف من قبل الملايين من التجار في جميع أنحاء العالم هو أفضل تقدير لعملنا! لقد قمت باختيارك وسنفعل كل ما يلزم لتلبية توقعاتك!
نحن فريق رائع معا!
إنستافوركس تعتز بالعمل بالنسبة لك!


الممثل وبطل مسابقة يو إف سي 6 وبطل حقيقي!
الرجل الذي حقق النجاح بعمله الدؤوب. الرجل الذي يذهب كما نريد.
سر نجاح تاكتاروف هو حركة مستمرة نحو الهدف.
اكشف عن جميع جوانب موهبتك!
اكتشف، وحاول، وافشل - ولكن لا تتوقف أبدا!
إنستافوركس. تبدأ قصة نجاحك من هنا!
EUR/USD
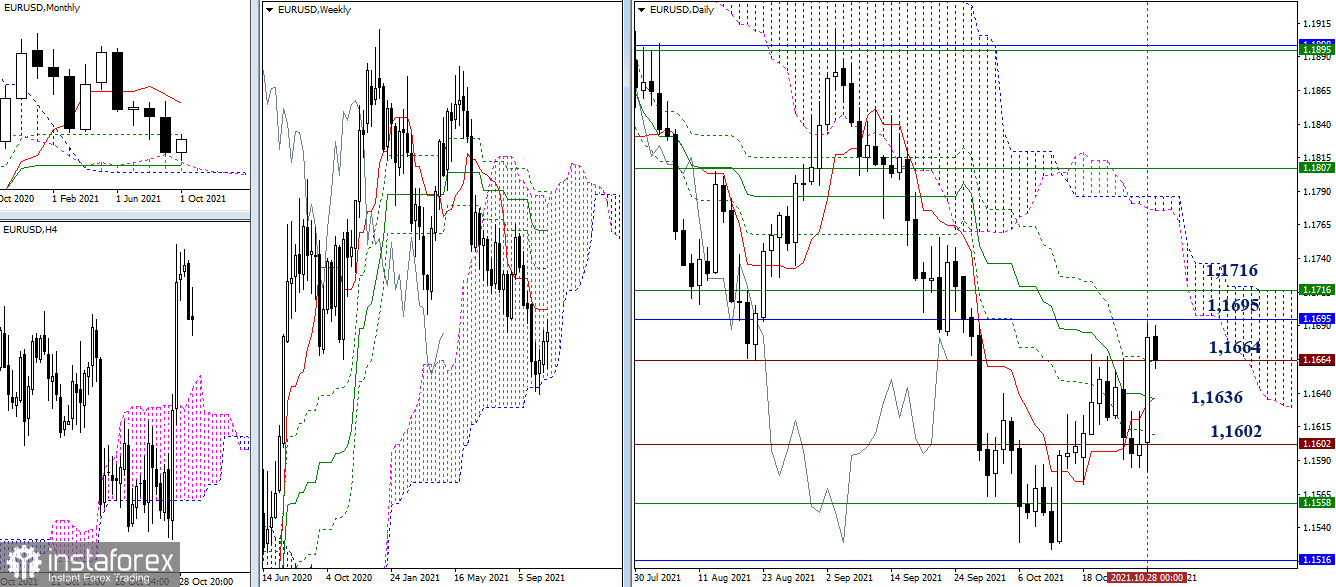
The end of the week and month is approaching. Yesterday, the bulls tried to break through the historical level of 1.1664. If the result can be consolidated in a weekly format, then the question of breaking through the resistance area of 1.1695 - 1.1716 (monthly Fibo Kijun + weekly Tenkan) will arise.
The failure to overcome the level of 1.1664, formation of a long upper shadow of the weekly candle and a return to the supports of 1.1636 (daily cross) or 1.1602 (historical level), will bring uncertainty back to the market.
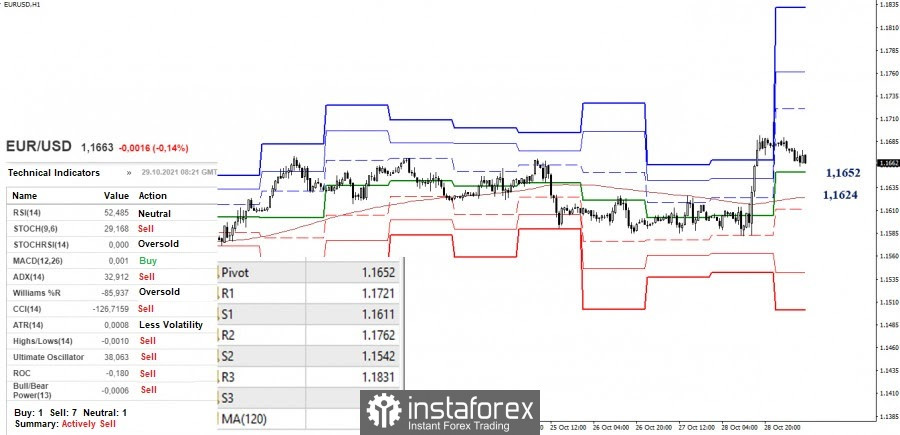
At the moment, there is a decline and test of the central pivot level (1.1652) in the smaller timeframes. The line of the weekly long-term trend (1.1624) is important for the bulls. In the case of consolidation below, the bears will regain their advantages. Their next pivot points will be the support of the classic pivot levels 1.1611 - 1.1542 - 1.1501. But if a rebound from the encountered support levels occurs in the near future and the high (1.1692) is updated, then bullish prospects will be represented by the resistances of the classic pivot levels 1.1721 - 1.1762 - 1.1831.
GBP/USD
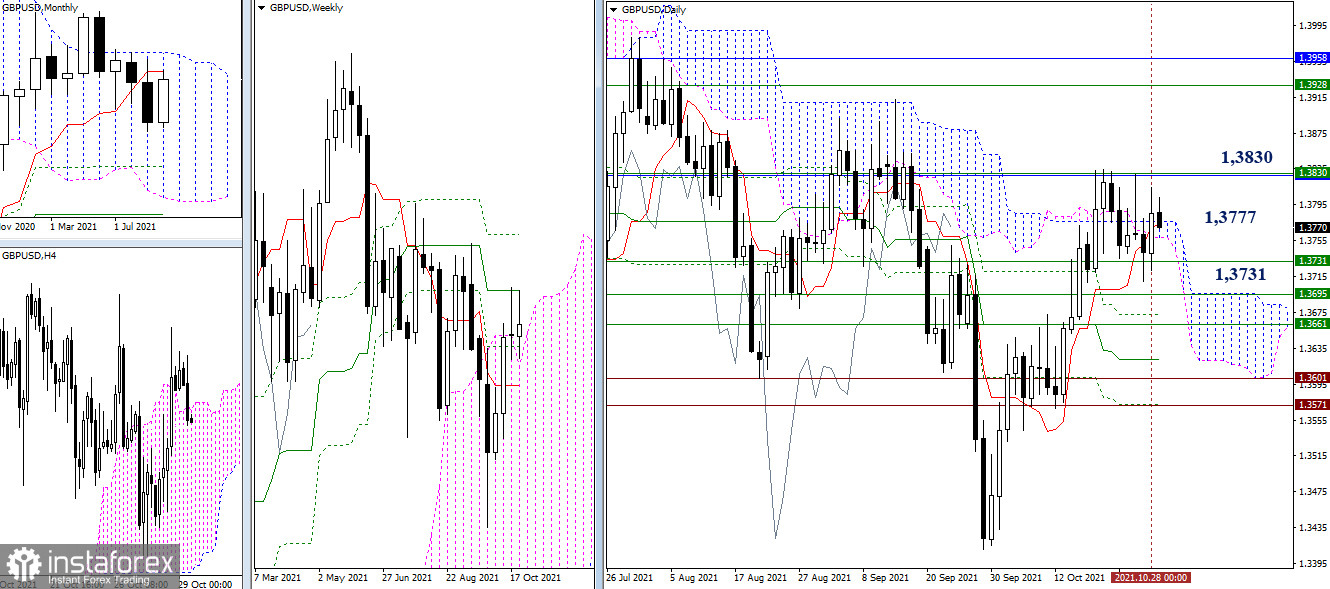
The situation could not be changed dramatically despite yesterday's bullish activity. The pair remained within the borders of 1.3830 (monthly short-term trend + weekly medium-term trend) and 1.3731 (weekly Fibo Kijun). In this case, the center of attraction is still the daily cloud (1.3777). Therefore, the possible prospects remained unchanged.
The breakdown of the support at 1.3731 will open the way to the next levels of 1.3695 (upper border of the weekly cloud) and 1.3661 (weekly short-term trend). The breakdown of the resistance at 1.3830 will make the zone of 1.3928-58 (weekly Fibo Kijun + monthly Senkou Span B) benchmarks.
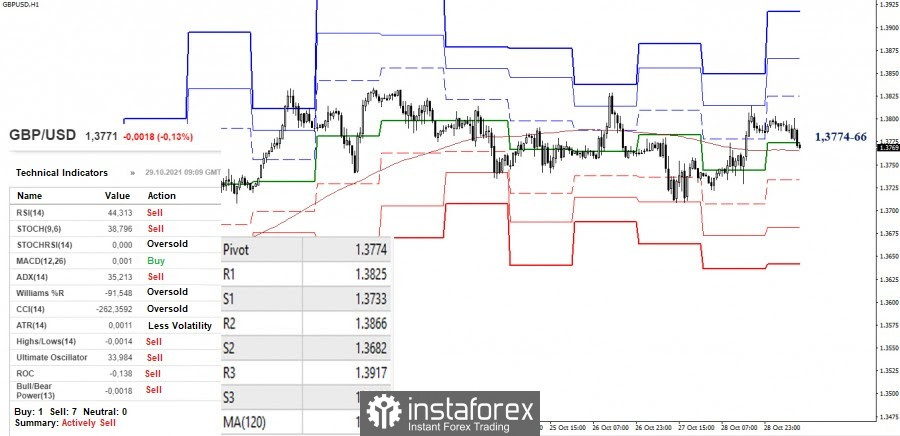
The key levels in the smaller timeframes (central pivot level 1.3774 + weekly long-term trend 1.3766) are currently joining forces with the daily center of gravity (1.3777). This area is currently being tested, so we can say that the market is dominated by uncertainty. Today's upward targets are set at 1.3825 - 1.3866 - 1.3917 (classic pivot levels), while the downward targets are at 1.3733 - 1.3682 - 1.3641 (classic pivot levels).
***
Ichimoku Kinko Hyo (9.26.52) and Kijun-sen levels in the higher time frames, as well as classic Pivot Points and Moving Average (120) on the H1 chart, are used in the technical analysis of the trading instruments.
*The market analysis posted here is meant to increase your awareness, but not to give instructions to make a trade.
InstaSpot analytical reviews will make you fully aware of market trends! Being an InstaSpot client, you are provided with a large number of free services for efficient trading.


