


فريقنا لديه أكثر من 7,000,000 من التجار!
كل يوم نعمل معا لتحسين التداول. نحصل على نتائج عالية ونمضي قدما.
الاعتراف من قبل الملايين من التجار في جميع أنحاء العالم هو أفضل تقدير لعملنا! لقد قمت باختيارك وسنفعل كل ما يلزم لتلبية توقعاتك!
نحن فريق رائع معا!
إنستافوركس تعتز بالعمل بالنسبة لك!


الممثل وبطل مسابقة يو إف سي 6 وبطل حقيقي!
الرجل الذي حقق النجاح بعمله الدؤوب. الرجل الذي يذهب كما نريد.
سر نجاح تاكتاروف هو حركة مستمرة نحو الهدف.
اكشف عن جميع جوانب موهبتك!
اكتشف، وحاول، وافشل - ولكن لا تتوقف أبدا!
إنستافوركس. تبدأ قصة نجاحك من هنا!
The USD/CAD pair is trading in the red corridor at 1.3489 on the H1 at the time of writing. It signaled that the upside movement is over and that the sellers could take the lead. It declined sharply as the US dollar index lost ground.
Later, the US economic figures could be decisive. Worse-than-expected data could send the USD/CAD toward fresh new lows. The Richmond Manufacturing Index and the Pending Home Sales will be published. Only better-than-expected data could help USD to rebound.
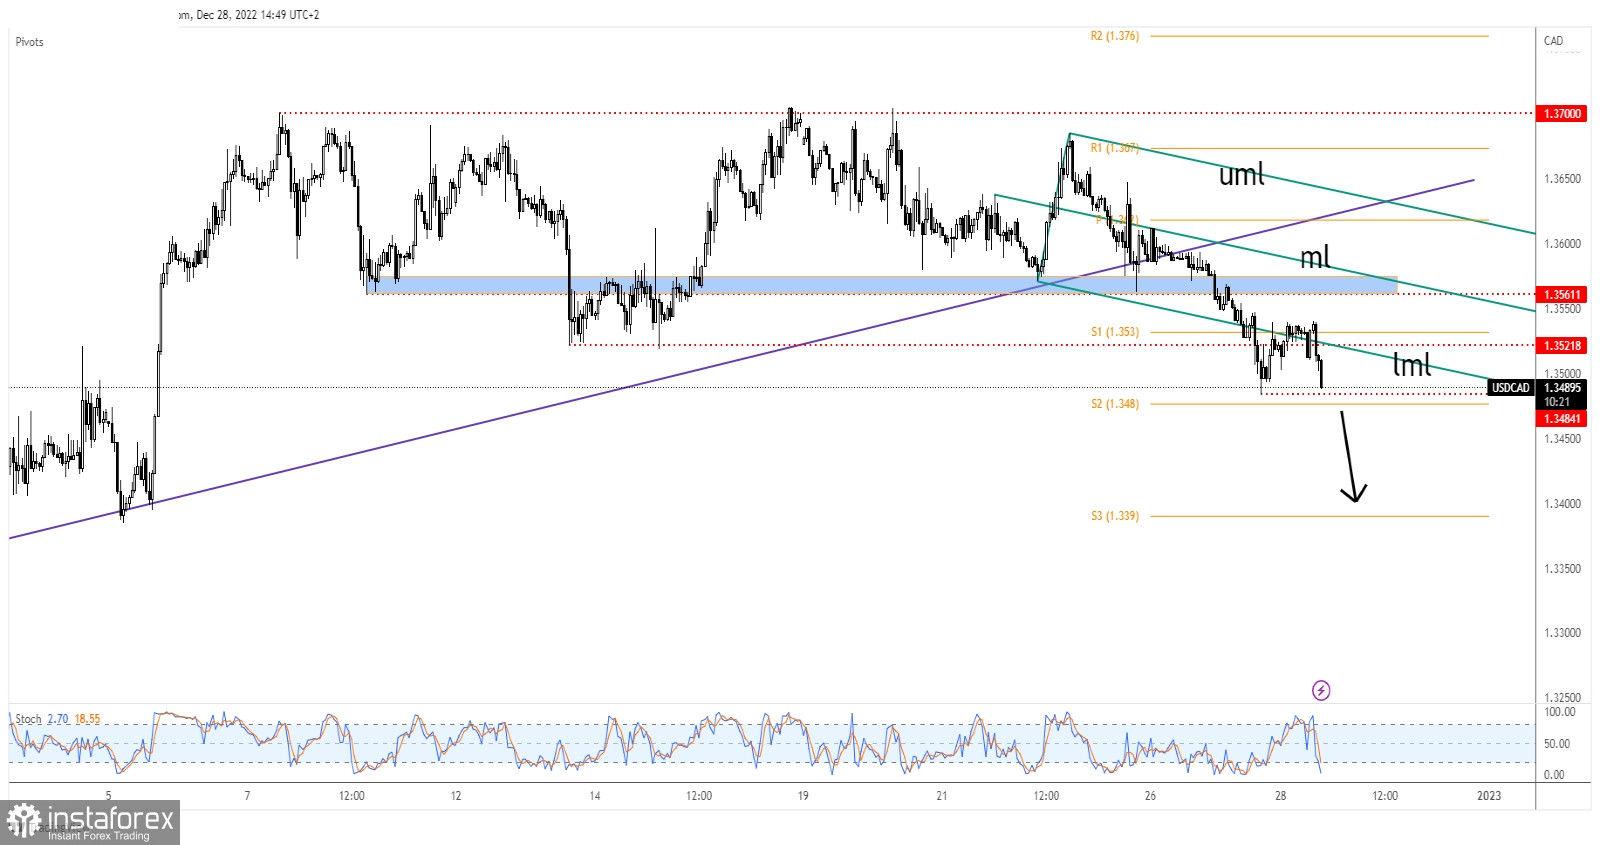
Technically, the USD/CAD was somehow expected to develop a larger drop after breaking below the uptrend line. It dipped below the 1.3561 and 1.3521 support levels signaling downside pressure.
It tried to rebound but it failed to stay above 1.3521 and above the lower median line (lml). It may hit 1.3484.
A valid breakout below 1.3484 and through the S2 (1.3480) brings new selling opportunities. The weekly S3 (1.3390) represents a downside target.
*The market analysis posted here is meant to increase your awareness, but not to give instructions to make a trade.
InstaSpot analytical reviews will make you fully aware of market trends! Being an InstaSpot client, you are provided with a large number of free services for efficient trading.


