


النماذج الفعلية

النماذج هي نماذج رسومية تتشكل في الرسم البياني حسب السعر. وفقا لأحد المسلمات التحليلية الفنية، فإن التاريخ (حركة السعر) يكرر نفسه. ويعني ذلك أن حركات الأسعار غالباً ما تكون متشابهة في نفس الأوضاع مما يجعل من الممكن التنبؤ بزيادة تطوير الوضع الذي يتسم باحتمال كبير.
النماذج ذات الصلة المقدمة من قبل إنستافوركس هي خدمة سهلة الاستخدام تسمح لك بمعرفة التغييرات الأخيرة في السوق والرد على الأدلة من السوق في الوقت المناسب. في خدمتنا، ستجد دائمًا النماذج الأكثر حداثة وملاءمة في أي زوج وأي إطار زمني.
Bearish Symmetrical Triangle
was formed on 21.03 at 10:30:41 (UTC+0)
signal strength 3 of 5
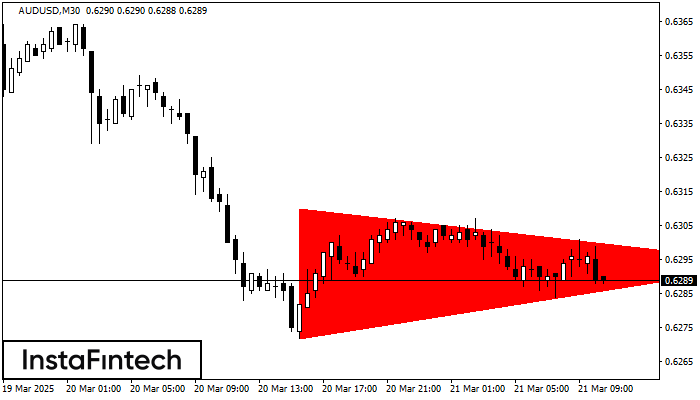
According to the chart of M30, AUDUSD formed the Bearish Symmetrical Triangle pattern. Description: The lower border is 0.6272/0.6294 and upper border is 0.6310/0.6294. The pattern width is measured on the chart at -38 pips. The formation of the Bearish Symmetrical Triangle pattern evidently signals a continuation of the downward trend. In other words, if the scenario comes true and AUDUSD breaches the lower border, the price could continue its move toward 0.6264.
- All
- All
- Bullish Rectangle
- Bullish Symmetrical Triangle
- Bullish Symmetrical Triangle
- Double Bottom
- Double Top
- Double Top
- Triple Top
- Triple Top
- Triple Top
- Triple Top
- All
- All
- Buy
- Sale
- All
- 1
- 2
- 3
- 4
- 5
Trojitý vrchol
was formed on 16.04 at 20:00:08 (UTC+0)
signal strength 3 of 5

Vzor Trojitý vrchol se vytvořil na grafu M30 u nástroje #MA. Charakteristika vzoru: okraje mají rostoucí úhel; spodní linie vzoru má souřadnice 508.17/512.83 s horní hranicí 523.81/521.51; průmět šířky činí
Open chart in a new window
Dvojité dno
was formed on 16.04 at 19:45:07 (UTC+0)
signal strength 2 of 5
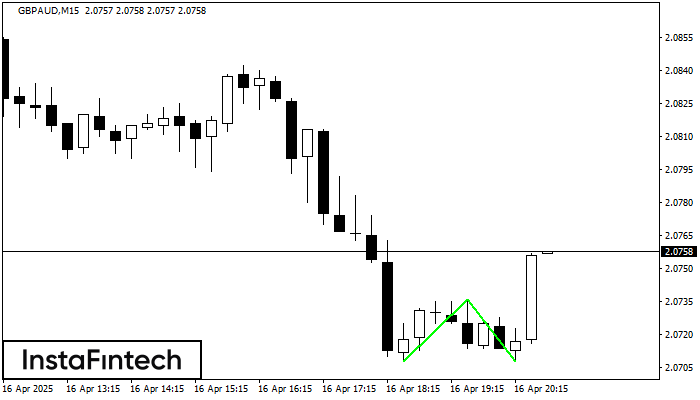
Vzor Dvojité dno se vytvořil na grafu M15 u nástroje GBPAUD; horní hranice je 2.0736; spodní hranice je 2.0708. Šířka vzoru je 28 bodů. V případě průlomu horní hranice 2.0736
Časové rámce M5 a M15 mohou mít více falešných vstupních bodů.
Open chart in a new window
Dvojité dno
was formed on 16.04 at 19:30:25 (UTC+0)
signal strength 1 of 5
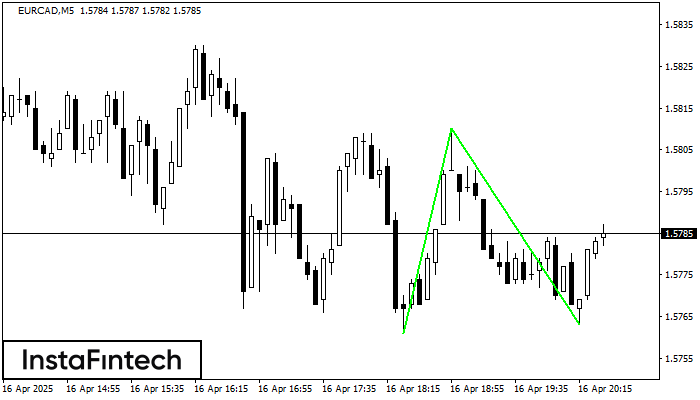
Vzor Dvojité dno se vytvořil na grafu M5 u nástroje EURCAD; horní hranice je 1.5810; spodní hranice je 1.5763. Šířka vzoru je 49 bodů. V případě průlomu horní hranice 1.5810
Časové rámce M5 a M15 mohou mít více falešných vstupních bodů.
Open chart in a new window
