


Our team has over 7,000,000 traders!
Every day we work together to improve trading. We get high results and move forward.
Recognition by millions of traders all over the world is the best appreciation of our work! You made your choice and we will do everything it takes to meet your expectations!
We are a great team together!
InstaSpot. Proud to work for you!


Actor, UFC 6 tournament champion and a true hero!
The man who made himself. The man that goes our way.
The secret behind Taktarov's success is constant movement towards the goal.
Reveal all the sides of your talent!
Discover, try, fail - but never stop!
InstaSpot. Your success story starts here!

EUR/USD
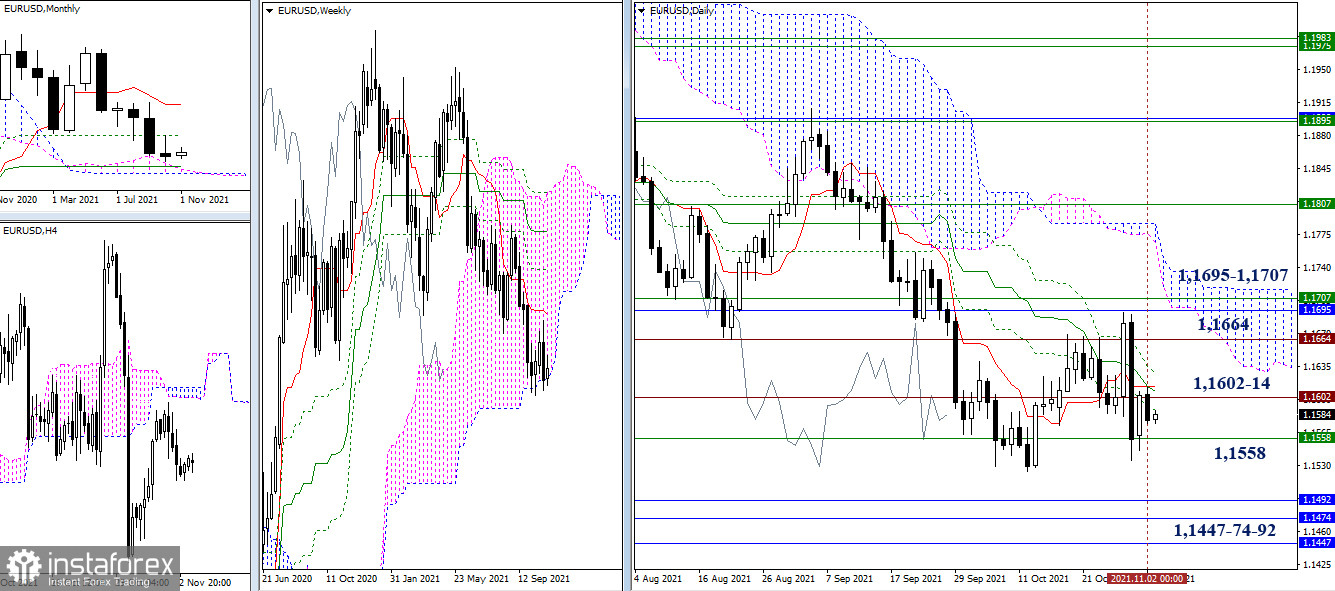
The bulls failed to further rise yesterday. As a result, events developed below the encountered resistance levels of 1.1602-14 (daily cross + historical level). The situation in its main conclusions and expectations has not dramatically changed over the past day The lower border of the weekly cloud (1.1558) still acts as the nearest support. Its breakdown and consolidation in the bearish zone relative to the weekly cloud will direct bearish interests to the monthly concentration of levels (1.1492-74-47).
Meanwhile, the role of the nearest resistance was retained by the area of 1.1602-14. Once it is broken, the bulls can wait for the resistance of 1.1664 (historical level) and 1.1695-1.1707 (monthly Fibo Kijun + weekly Tenkan).
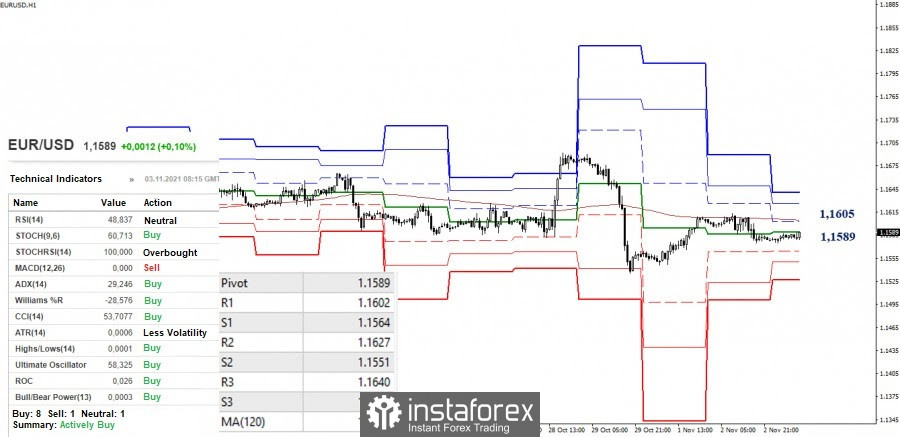
The pair has been trading in the correction zone of the smaller timeframes for quite some time, attempting to break through the key levels, which hold the defense in the area of 1.1589 (central Pivot level) - 1.1605 (weekly long-term trend) today. It should be noted that breaking through the key levels determines the presence of an advantage. Currently, downward targets are at 1.1564 - 1.1551 - 1.1526 (classic pivot levels). In the event of a breakdown of 1.1589 - 1.1605, the next upward targets can be noted at 1.1627 and 1.1640 (classic pivot levels).
GBP/USD
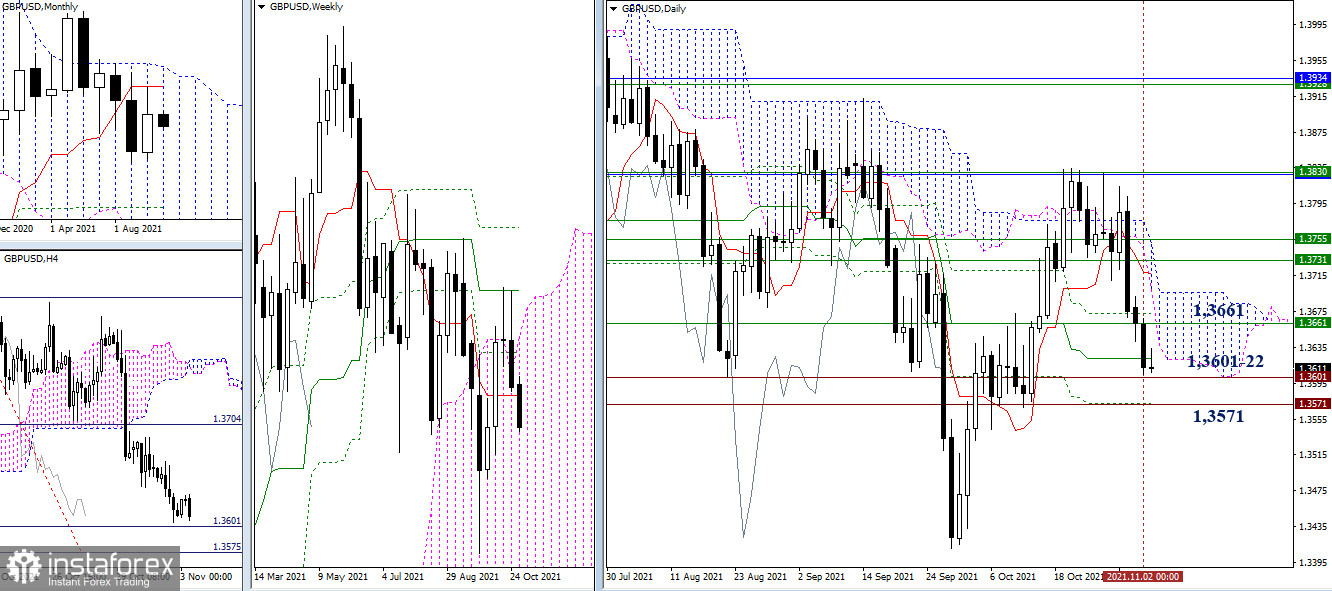
Yesterday, the bears continued their decline and started testing the daily medium-term trend (1.3622). In this area, their main interest comes down to the formation of the result of interaction with the zone 1.3601 - 1.3571, where historical levels, the final line of the daily golden cross, and the target for the breakdown of the H4 cloud have combined their efforts. The previously broken level of 1.3661 (weekly Tenkan) now acts as the nearest resistance.
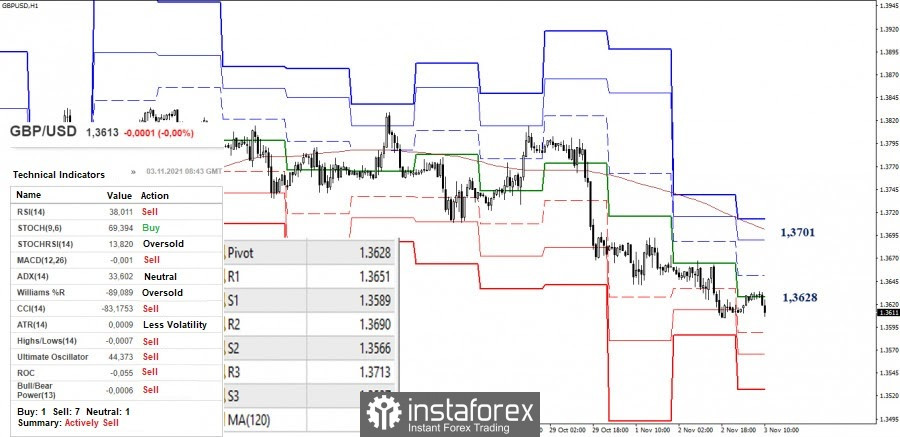
The advantage in the smaller timeframes is on the bears' side. Their downward targets are set at 1.3589 - 1.3566 - 1.3527 (classic pivot levels) today. At the moment, the first key level of .3628 (central pivot level) is being tested for strength. The next key level allows us to develop a corrective rally to 1.3701 (weekly long-term trend). Along this path, the nearest resistance levels can be considered at 1.3651 and 1.3690 (classic pivot levels).
***
Ichimoku Kinko Hyo (9.26.52) and Kijun-sen levels in the higher time frames, as well as classic Pivot Points and Moving Average (120) on the H1 chart, are used in the technical analysis of the trading instruments.
*এখানে পোস্ট করা মার্কেট বিশ্লেষণ আপনার সচেতনতা বৃদ্ধির জন্য প্রদান করা হয়, ট্রেড করার নির্দেশনা প্রদানের জন্য প্রদান করা হয় না।
ইন্সটাফরেক্স বিশ্লেষণমূলক পর্যালোচনাগুলো আপনাকে মার্কেট প্রবণতা সম্পর্কে পুরোপুরি সচেতন করবে! ইন্সটাফরেক্সের একজন গ্রাহক হওয়ায়, দক্ষ ট্রেডিং এর জন্য আপনাকে অনেক সেবা বিনামূল্যে প্রদান করা হয়।


