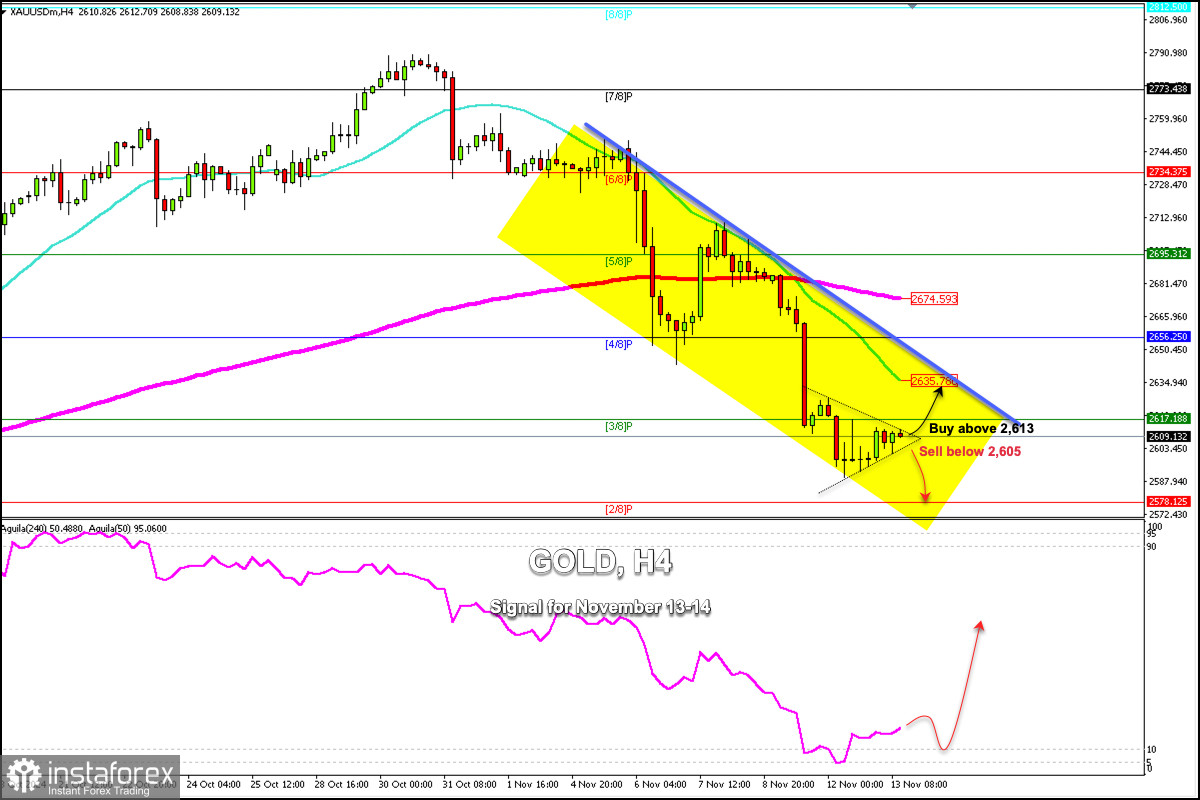
- আজও দৈনিক ভিত্তিতে স্বর্ণের মূল্যের ঊর্ধ্বমুখী প্রবণতা বজায় রয়েছে এবং সাপ্তাহিক সর্বোচ্চ $3036 লেভেলের আশেপাশে স্বর্ণের ট্রেড করা হচ্ছে। এর পেছনে একাধিক কারণ রয়েছে — যেমন যুক্তরাষ্ট্রের বাণিজ্যনীতির অনিশ্চয়তা এবং
লেখক: Irina Yanina
12:17 2025-03-27 UTC+2
22
আজ EUR/USD পেয়ারের মূল্যের ঊর্ধ্বমুখী প্রবণতা পরিলক্ষিত হচ্ছে, যার ফলে টানা ছয়দিনের দরপতনের ধারাবাহিকতার সমাপ্তি ঘটেছে। বুলিশ মোমেন্টাম এই পেয়ারের স্পট প্রাইসকে 1.0785 লেভেলের দিকে তুলে নিচ্ছে, যা একটি নতুনলেখক: Irina Yanina
11:00 2025-03-27 UTC+2
20
স্টক বিশ্লেষণমার্কিন স্টক মার্কেট দরপতনের সম্মুখীন: ট্রাম্প শুল্ক আরোপ করায় অর্থনৈতিক পরিস্থিতির ওপর আঘাত
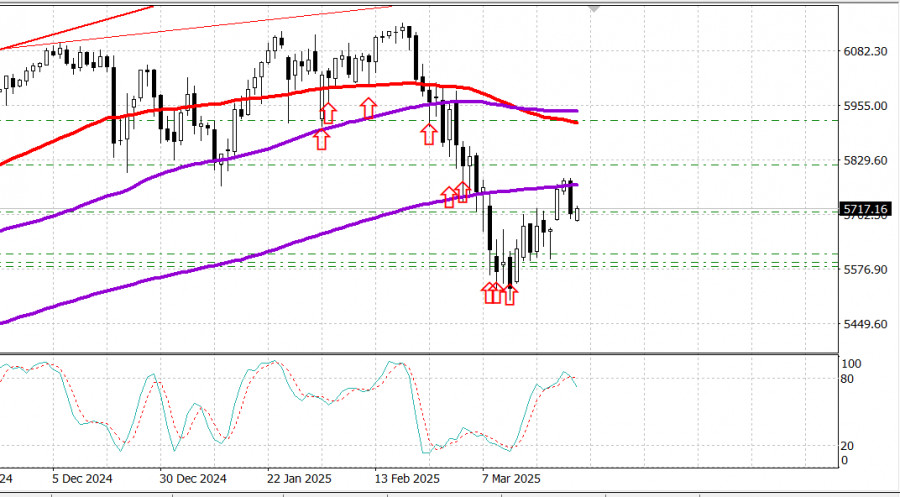
S&P 500 মার্কিন স্টক মার্কেটের আপডেট, ২৭ মার্চ নতুন করে শুল্ক আরোপের আশঙ্কা এবং অর্থনৈতিক পরিস্থিতির অনিশ্চয়তার মধ্যে মার্কিন স্টক মার্কেটে নিম্নমুখী প্রবণতা শুরু হয়েছে। বুধবারের প্রধান মার্কিন স্টক সূচকসমূহেরলেখক: Jozef Kovach
10:33 2025-03-27 UTC+2
30
- স্টক বিশ্লেষণ
মার্কিন স্টক মার্কেট, ২৭ মার্চ: ট্রাম্পের সর্বশেষ শুল্ক আরোপের ঘোষণার পর S&P 500 ও নাসডাক সূচকে বড় দরপতন
মঙ্গলবারের নিয়মিত সেশনের শেষে, যুক্তরাষ্ট্রের প্রধান স্টক সূচকসমূহে নিম্নমুখী প্রবণতা পরিলক্ষিত হয়েছে। S&P 500 সূচক 1.12% হ্রাস পেয়েছে, নাসডাক 100 সূচক 2.24% হ্রাস পেয়েছে, এবং ডাও জোন্স ইন্ডাস্ট্রিয়াল অ্যাভারেজ 0.31%লেখক: Jakub Novak
10:15 2025-03-27 UTC+2
23
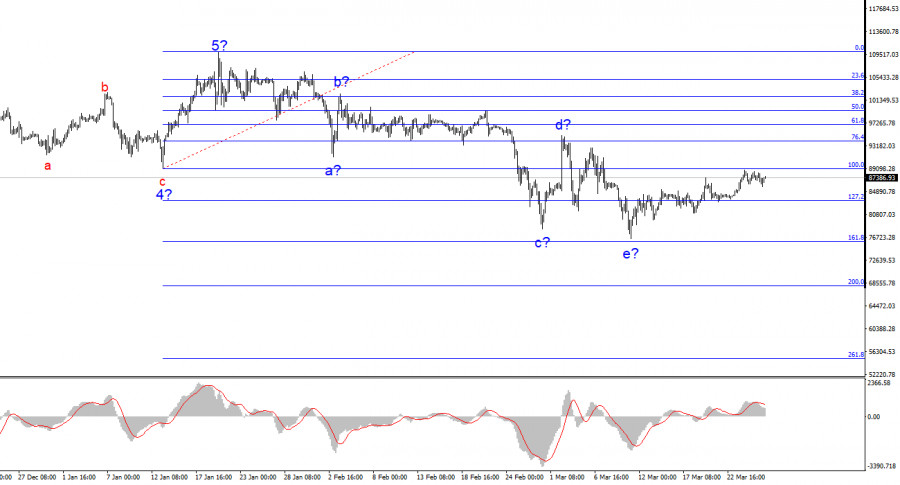
৪-ঘণ্টার চার্টে BTC/USD-এর ওয়েভ স্ট্রাকচার বেশ স্পষ্ট। পাঁচটি পূর্ণাঙ্গ ওয়েভ দিয়ে গঠিত একটি বুলিশ প্রবণতা সম্পন্ন হওয়ার পর এখন একটি কারেকটিভ ডাউনওয়ার্ড ফেজ শুরু হয়েছে, যা বর্তমানে কারেকশনের রূপে দেখালেখক: Chin Zhao
09:57 2025-03-27 UTC+2
25
বিটকয়েন ও ইথেরিয়ামের মূল্য বর্তমানে ঊর্ধ্বমুখী প্রবণতা ধরে রাখতে কিছুটা চ্যালেঞ্জের মুখে পড়েছে। তবে এটি মূলত ডোনাল্ড ট্রাম্পের সাম্প্রতিক রাজনৈতিক বিবৃতির প্রতিক্রিয়ায় ঝুঁকিপূর্ণ অ্যাসেটগুলোর চাহিদা কমে যাওয়ার কারণে ঘটছে —লেখক: Miroslaw Bawulski
09:44 2025-03-27 UTC+2
21
- পূর্বাভাস
USD/JPY: নতুন ট্রেডারদের জন্য ট্রেডিংয়ের সহজ টিপস, ২৭ মার্চ। গতকালের ফরেক্স ট্রেডের বিশ্লেষণ
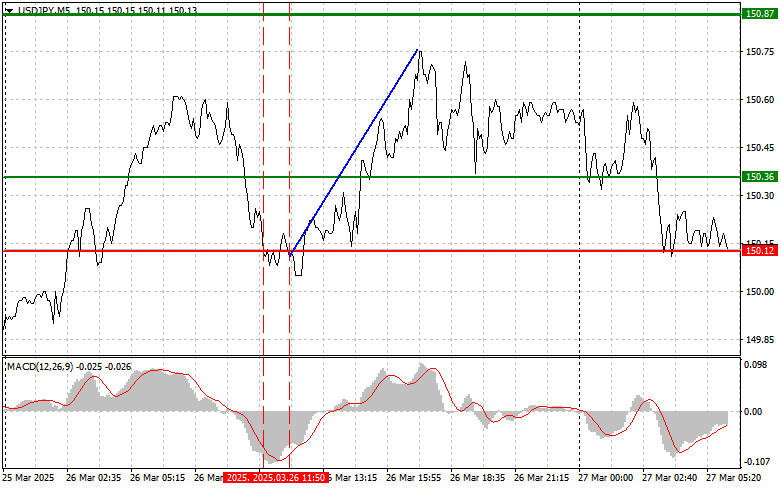
যখন MACD সূচকটি শূন্যের বেশ নিচে নেমে গিয়েছিল তখন এই পেয়ারের মূল্য প্রথমবার 150.12 এর লেভেল টেস্ট করেছিল, যার ফলে এই পেয়ারের মূল্যের নিম্নমুখী সম্ভাবনা সীমিত হয়ে পড়ে। এই কারণেইলেখক: Jakub Novak
09:36 2025-03-27 UTC+2
22
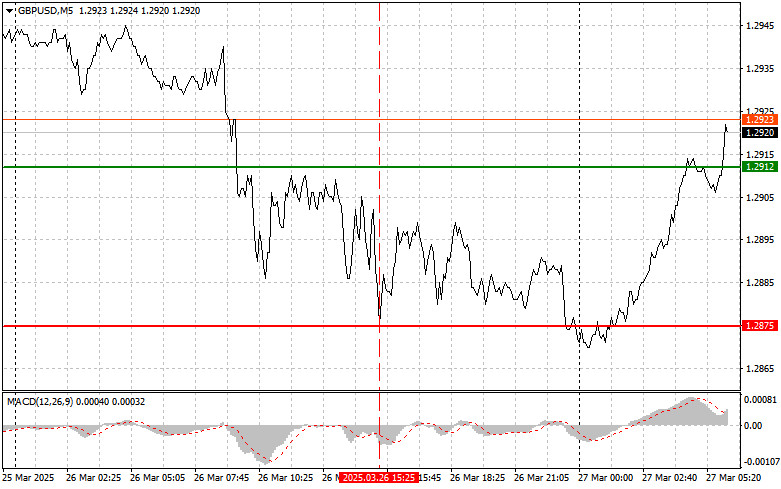
পূর্বাভাসGBP/USD: নতুন ট্রেডারদের জন্য ট্রেডিংয়ের সহজ টিপস, ২৭ মার্চ। গতকালের ফরেক্স ট্রেডের পর্যালোচনা
যখন MACD সূচকটি শূন্যের বেশ নিচে নেমে গিয়েছিল তখন এই পেয়ারের মূল্য 1.2875 এর লেভেল টেস্ট করেছিল, যার ফলে এই পেয়ারের মূল্যের নিম্নমুখী হওয়ার সম্ভাবনা সীমিত হয়ে যায়। এই কারণেইলেখক: Jakub Novak
09:28 2025-03-27 UTC+2
17
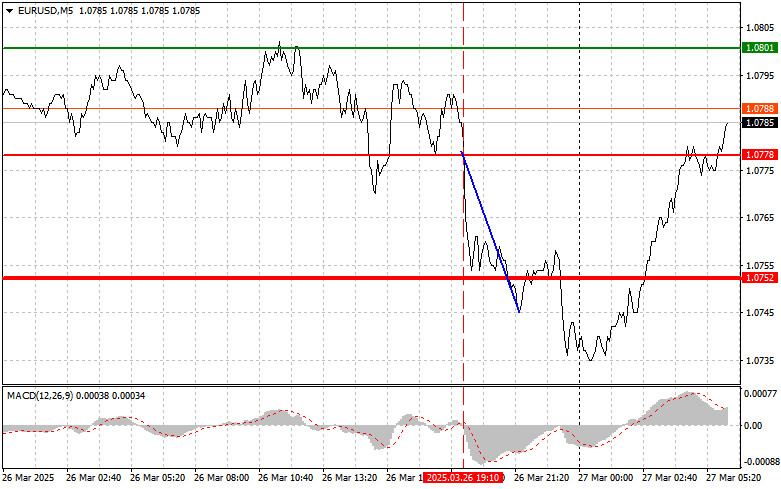
পূর্বাভাসEUR/USD: নতুন ট্রেডারদের জন্য ট্রেডিংয়ের সহজ টিপস, ২৭ মার্চ। গতকালের ফরেক্স ট্রেডের বিশ্লেষণ
ইউরোর ট্রেডের বিশ্লেষণ এবং ট্রেডিংয়ের টিপস যখন MACD সূচকটি শূন্যের নিচের দিকে নামতে শুরু করেছিল তখন এই পেয়ারের মূল্য 1.0778 এর লেভেল টেস্ট করেছিল, যা ইউরো বিক্রির জন্য একটি সঠিকলেখক: Jakub Novak
09:09 2025-03-27 UTC+2
19


