


Our team has over 7,000,000 traders!
Every day we work together to improve trading. We get high results and move forward.
Recognition by millions of traders all over the world is the best appreciation of our work! You made your choice and we will do everything it takes to meet your expectations!
We are a great team together!
InstaSpot. Proud to work for you!


Actor, UFC 6 tournament champion and a true hero!
The man who made himself. The man that goes our way.
The secret behind Taktarov's success is constant movement towards the goal.
Reveal all the sides of your talent!
Discover, try, fail - but never stop!
InstaSpot. Your success story starts here!

On Wednesday, the EUR/USD pair continued its decline after breaking below the support zone of 1.1070–1.1081. The downward movement may continue towards the next corrective level of 127.2%, at 1.0984. A rebound from the 1.0984 level could favor the euro and lead to some upward movement. However, the trend has shifted to bearish.
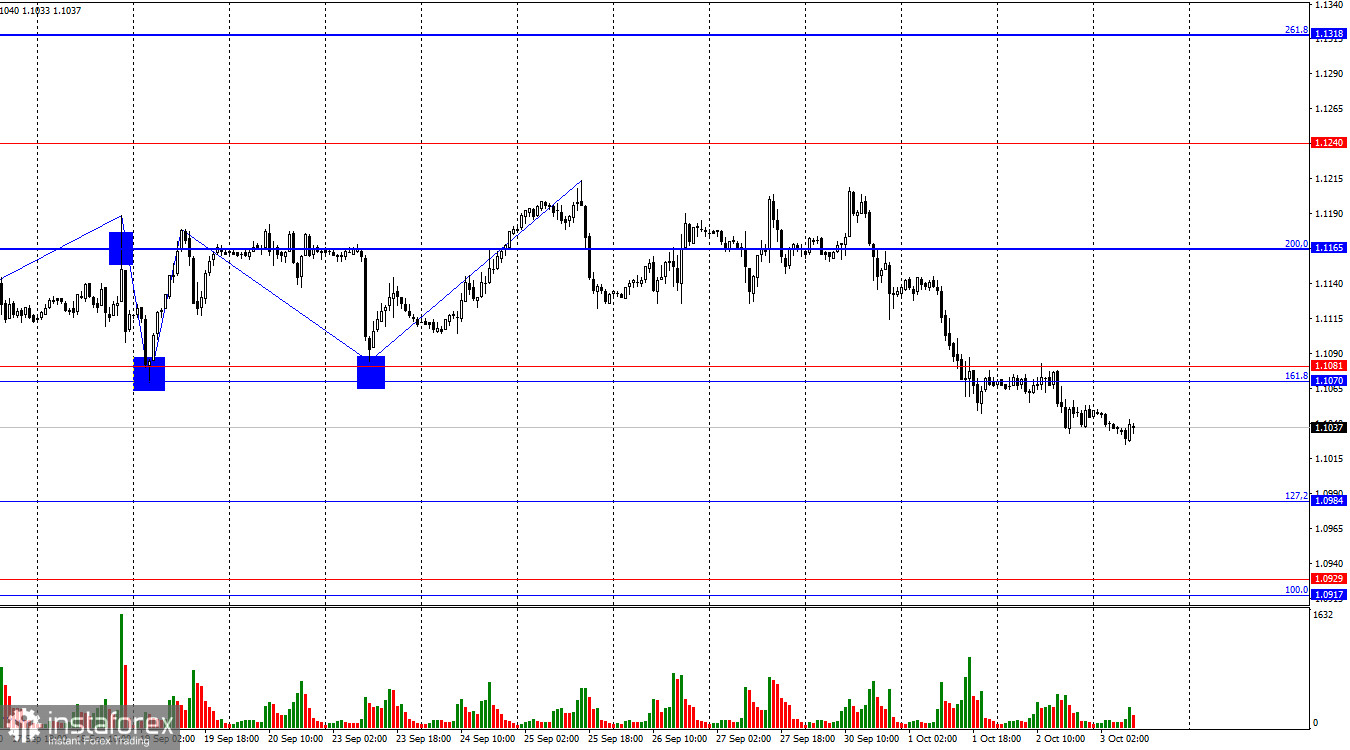
The wave structure has become slightly more complex yet remains clear overall. The last completed upward wave (September 23–25) broke through the previous peaks, while the current downward wave has broken the lows of the previous two waves. Thus, the pair is now starting to form a new bearish trend. Consolidation below the support zone of 1.1070–1.1081 suggests further decline, although a pullback might occur today or tomorrow.
The fundamental backdrop on Wednesday continued to support active bearish moves in the market. This week, there were plenty of reasons for traders to sell. Inflation in the Eurozone is falling faster than expected, and the ECB is ready for an unscheduled rate cut. Meanwhile, the Fed is not planning to cut rates by 0.50% in the near future, and the JOLTS and ADP reports showed decent numbers. As a result, the strength of the U.S. dollar is unsurprising. Since the bullish trend has now been invalidated, I expect further declines in the pair. The first key area to watch is the 1.1013 level, where the last downward wave finished on the 4-hour chart. A break below this level would confirm the shift in market sentiment to bearish. Today's ISM services index may further reinforce the bears' confidence in their actions.
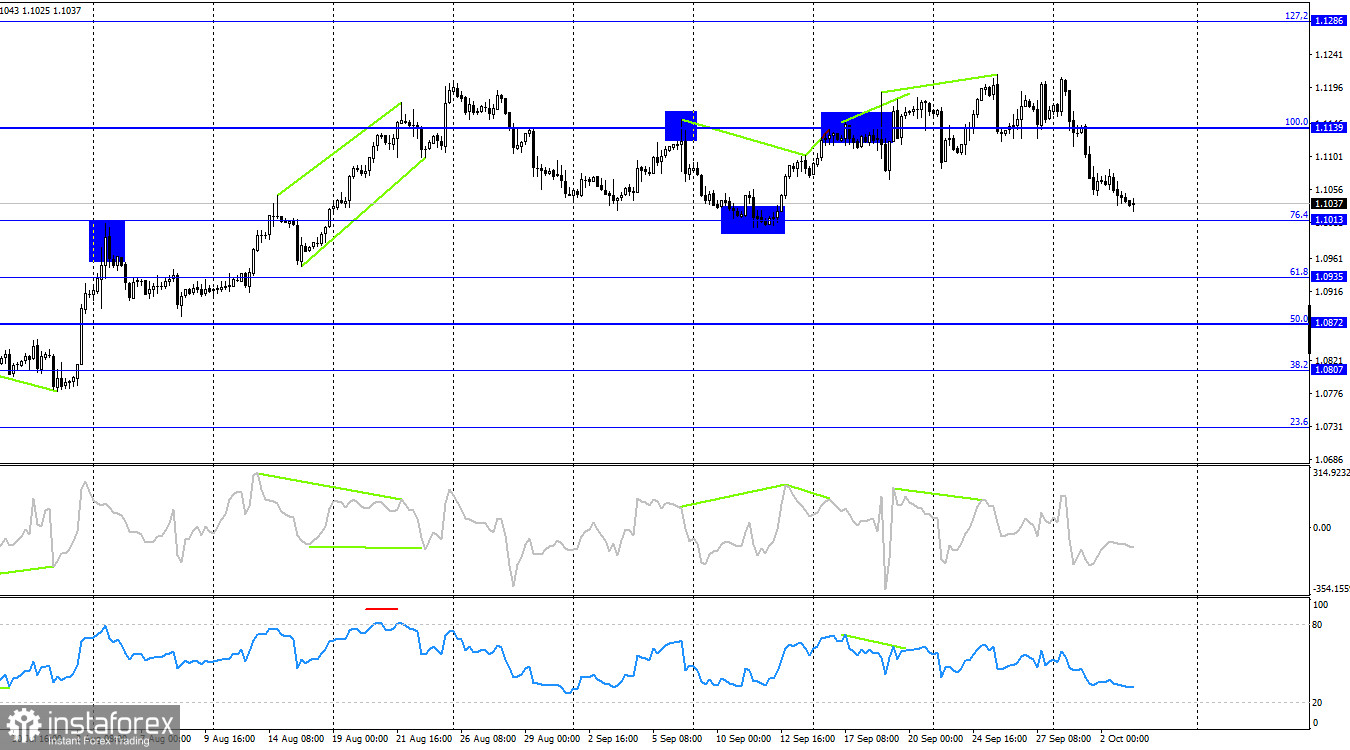
On the 4-hour chart, the pair turned in favor of the U.S. dollar after forming a series of bearish divergences in the RSI and CCI indicators. The RSI also entered the overbought territory a few weeks ago. However, considering the recent strength and momentum of the bulls, it's still hard to believe in a sharp drop for the euro. Bears may encounter resistance around the 1.1013 level, but consolidation below this point would push them toward the 50.0% corrective level at 1.0872.
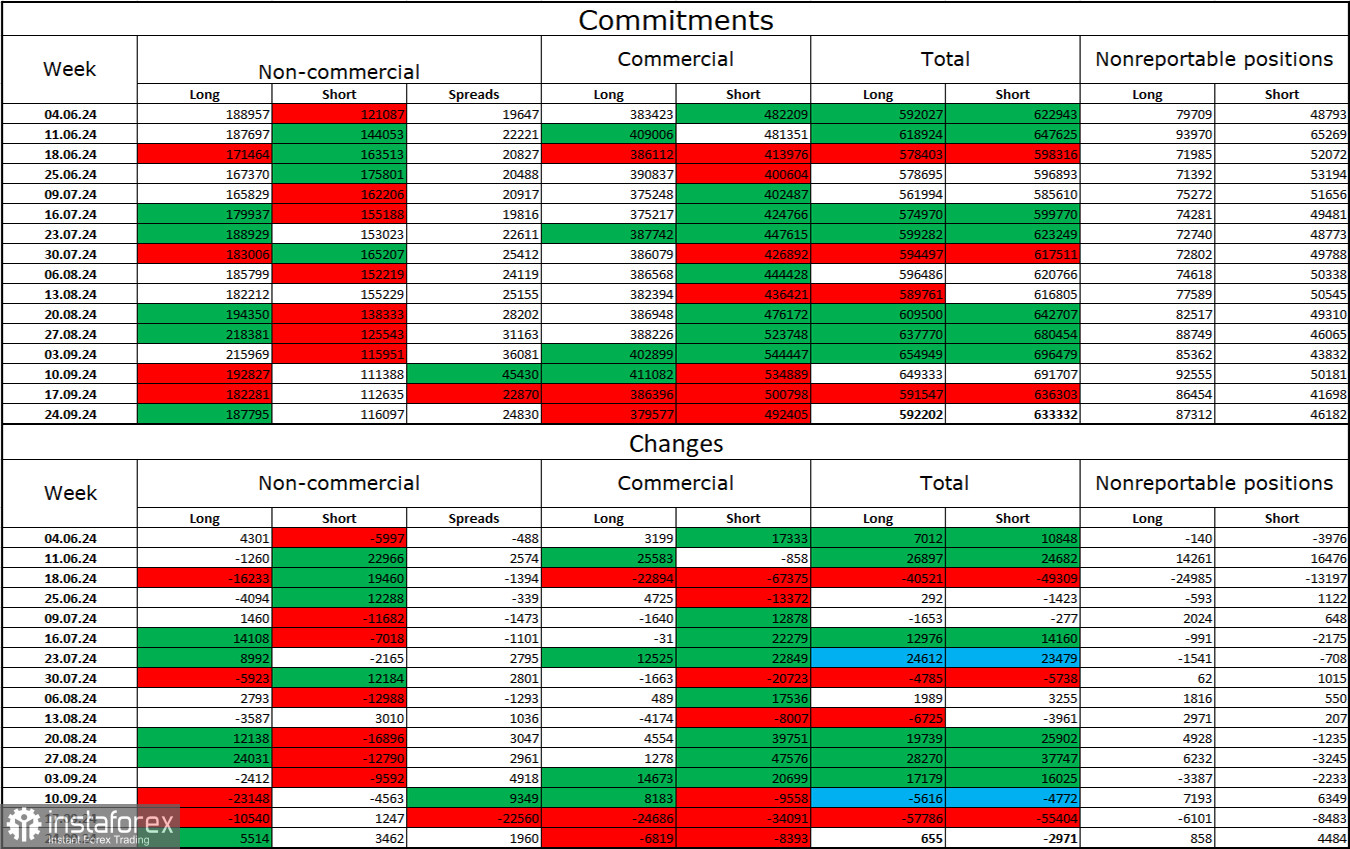
In the latest reporting week, speculators opened 5,514 new long positions and 3,462 short positions. The sentiment of the "Non-commercial" group shifted to bearish several months ago, but currently, bulls are actively dominating again. The total number of long positions held by speculators is now 188,000, while short positions amount to just 116,000.
However, for the third week in a row, large players have been offloading the euro. In my view, this could be a sign of a new bearish trend or, at the very least, signal a corrective movement. The key factor in the dollar's previous decline—expectations of FOMC monetary easing—has already been priced in. Now, the dollar has fewer reasons to fall. While new factors may arise over time, the U.S. currency is more likely to strengthen at this point. Active euro selling hasn't started yet, but if it does, the chances of a bearish trend will increase.
On October 3, the economic calendar contains several important releases. The impact on trader sentiment tomorrow may be moderate in strength.
Selling opportunities for the pair were available after consolidation below the 1.1139 level on the 4-hour chart, with targets at 1.1081 and 1.1070. Both targets were reached. Sales can be held with targets at 1.1013 and 1.0984. I wouldn't consider buying the pair at the moment, as there is a high probability that the pair has started a bearish trend. However, a slight bounce may occur from the 1.1013 level.
The Fibonacci grids are drawn from 1.0917–1.0668 on the hourly chart and from 1.1139–1.0603 on the 4-hour chart.
*এখানে পোস্ট করা মার্কেট বিশ্লেষণ আপনার সচেতনতা বৃদ্ধির জন্য প্রদান করা হয়, ট্রেড করার নির্দেশনা প্রদানের জন্য প্রদান করা হয় না।
ইন্সটাফরেক্স বিশ্লেষণমূলক পর্যালোচনাগুলো আপনাকে মার্কেট প্রবণতা সম্পর্কে পুরোপুরি সচেতন করবে! ইন্সটাফরেক্সের একজন গ্রাহক হওয়ায়, দক্ষ ট্রেডিং এর জন্য আপনাকে অনেক সেবা বিনামূল্যে প্রদান করা হয়।


