


Our team has over 7,000,000 traders!
Every day we work together to improve trading. We get high results and move forward.
Recognition by millions of traders all over the world is the best appreciation of our work! You made your choice and we will do everything it takes to meet your expectations!
We are a great team together!
InstaSpot. Proud to work for you!


Actor, UFC 6 tournament champion and a true hero!
The man who made himself. The man that goes our way.
The secret behind Taktarov's success is constant movement towards the goal.
Reveal all the sides of your talent!
Discover, try, fail - but never stop!
InstaSpot. Your success story starts here!

বৃহস্পতিবার EUR/USD কারেন্সি পেয়ারের মূল্যের নিম্নমুখী মুভমেন্ট অব্যাহত ছিল। ইউরোপীয় কেন্দ্রীয় ব্যাংকের (ECB) বৈঠকের আগে, চলাকালীন সময়ে এবং পরবর্তী সময়ে ইউরো দরপতনের শিকার হয়েছে। যেমনটি আগেই উল্লেখ করা হয়েছে, বর্তমানে ইউরোর জন্য মৌলিক এবং সামষ্টিক অর্থনৈতিক পটভূমি খুব বেশি গুরুত্বপূর্ণ নয়। ইউরো এতটাই অতিরিক্ত ক্রয় করা হয়েছে এবং অযৌক্তিকভাবে উচ্চ মূল্যে রয়েছে যে কোনো সংবাদ বা প্রতিবেদন ছাড়াই ইউরোর দরপতন অব্যাহত থাকতে পারে। আমরা এখন ঠিক এই ঘটনাই পর্যবেক্ষণ করছি। ইসিবির বৈঠকের পরে আমরা ভেবেছিলাম যে ইউরোর মূল্যের উর্ধ্বমুখী রিবাউন্ড হতে পারে, কারণ মার্কেটের ট্রেডাররা ইতোমধ্যেই সুদের হার কমানোর বিষয়টি মূল্যায়ন করে ফেলেছে। তবে আমরা দেখতে পাচ্ছি, এমনটি ঘটেনি, কারণ ইসিবির সুদের হার মার্কেটে এখন তেমন একটা গুরুত্বপূর্ণ নয়। এছাড়াও, ক্রিস্টিন লাগার্ড উল্লেখ করেছেন যে ডিসেম্বরে কেন্দ্রীয় ব্যাংক আরেকবার আর্থিক নীতিমালা নমনীয় করতে পারে, তাই ইউরোর বিক্রি বন্ধ হয়নি। বর্তমানে, প্রযুক্তিগতভাবে এমন কোন সংকেত নেই যা আসন্ন কারেকশনের ইঙ্গিত দেয়। প্রতিদিনই ইউরোর মূল্য নিম্নমুখী হচ্ছে, যা পুরোপুরি যৌক্তিক।
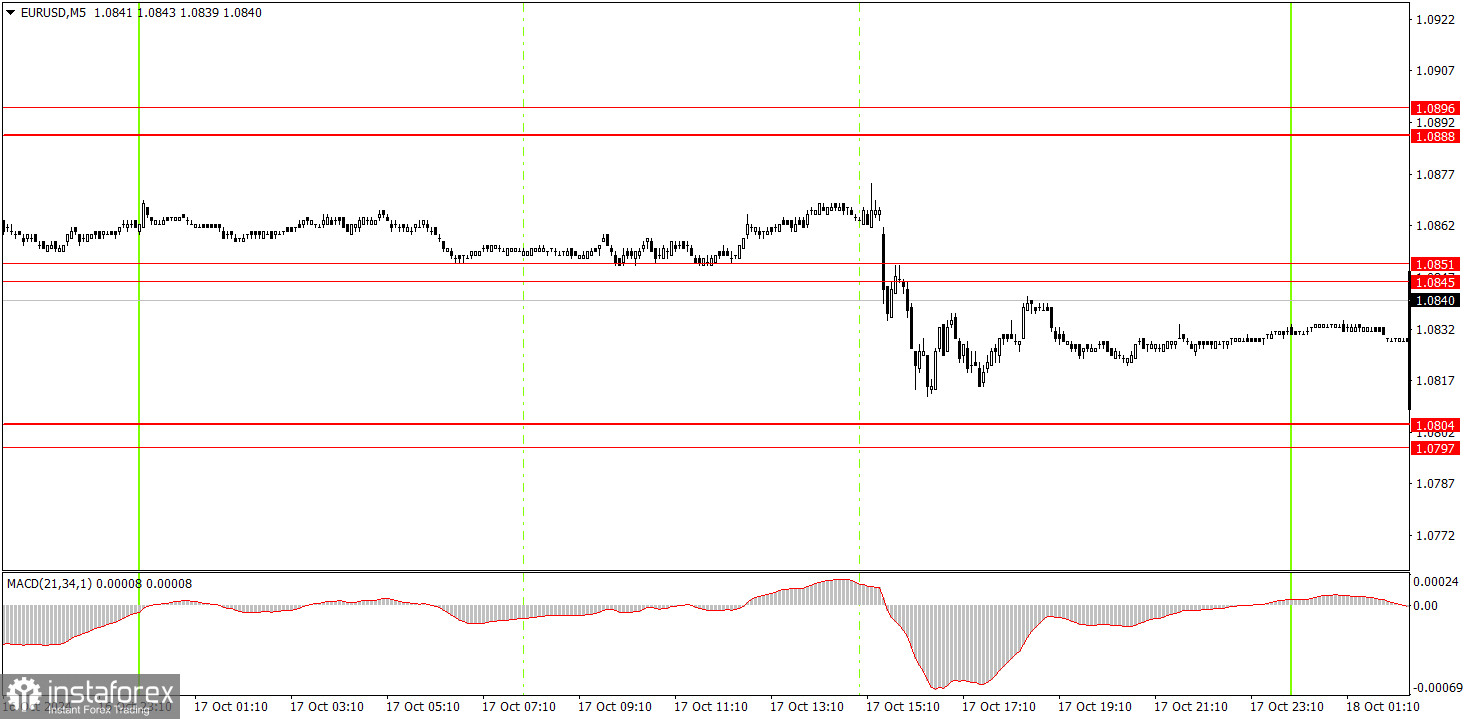
বৃহস্পতিবার, ৫-মিনিট টাইমফ্রেমে একটি সিগন্যাল তৈরি হয়েছিল, তবে এটি ইসিবির বৈঠকের ফলাফল ঘোষণার সময় এবং লাগার্ডের বক্তব্যের আধা ঘণ্টা আগে ঘটেছিল। সেই সময়ে মার্কেটে এন্ট্রি করা বেশ ঝুঁকিপূর্ণ ছিল। সুতরাং, গতকাল মার্কেটের বাইরে থাকাই সঠিক সিদ্ধান্ত ছিল। এই পেয়ারের মূল্যের খুবই কম ভোলাটিলিটি বিরাজ করছে, যা লোয়ার টাইমফ্রেমে এই পেয়ারের ট্রেডিংকে খুবই কঠিন করে তুলেছে।
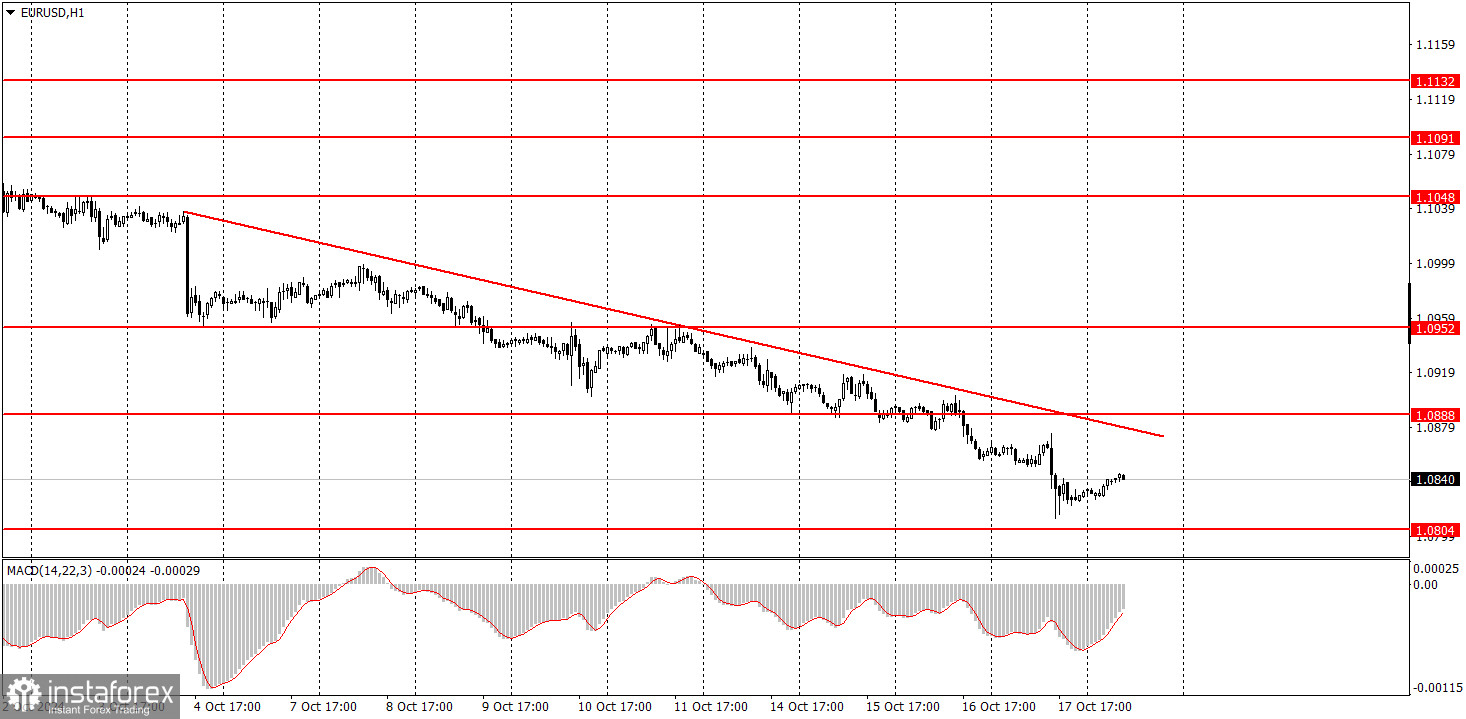
এক ঘন্টার টাইম ফ্রেমে EUR/USD পেয়ারের মূল্যের নতুন নিম্নমুখী প্রবণতার গঠনের প্রথম ধাপ দেখা যাচ্ছে। দুর্ভাগ্যবশত, মধ্যমেয়াদে আবার অযৌক্তিকভাবে ডলারের বিক্রি শুরু হতে পারে, কেননা কেউ জানে না মার্কেটের ট্রেডাররা কতক্ষণ ফেডের আর্থিক নীতিমালার নমনীয়করণ দ্বারা প্রভাবিত হতে থাকবে। তবে, এক ঘন্টার টাইমফ্রেমে স্পষ্টভাবেই এই পেয়ারের মূল্যের নিম্নমুখী প্রবণতা পরিলক্ষিত হচ্ছে। কোন ধরনের কারেকশন ছাড়াই ইউরোর আরও দরপতনের আশা করা যায়, যদিও একটি কারেকশন হলে সেটি আরও যৌক্তিক হবে।
শুক্রবার, 1.0845-1.0851 এরিয়ার মধ্যে ট্রেডিং করা যেতে পারে। আজ কোনও মৌলিক বা সামষ্টিক অর্থনৈতিক পটভূমি নেই, তাই এই পেয়ারের মূল্যের শক্তিশালী মুভমেন্টের সম্ভাবনা কম।
৫-মিনিট টাইমফ্রেমে, নিম্নলিখিত লেভেলগুলো বিবেচনা করুন 1.0726-1.0733, 1.0797-1.0804, 1.0845-1.0851, 1.0888-1.0896, 1.0940-1.0951, 1.1011, 1.1048, 1.1091, 1.1132-1.1140, এবং 1.1189-1.1191। শুক্রবার, ইউরোজোন বা যুক্তরাষ্ট্রে কোনো উল্লেখযোগ্য বা আকর্ষণীয় ইভেন্ট পরিকল্পিত নেই। যুক্তরাষ্ট্রে কয়েকটি স্বল্প গুরুত্বসম্পন্ন প্রতিবেদন প্রকাশিত হবে, তবে এগুলোর প্রভাবে মার্কেটে ৩০ পিপসের বেশি মুভমেন্ট ঘটার সম্ভাবনা নেই।
1) সিগন্যালের শক্তি: সিগন্যাল গঠন করতে কতক্ষণ সময় নেয় তার উপর ভিত্তি করে সিগন্যালের শক্তি নির্ধারণ করা হয় (বাউন্স বা লেভেলের ব্রেকথ্রু)। এটি গঠন করতে যত কম সময় লাগবে, সিগন্যাল তত শক্তিশালী হবে।
2) ভুল সিগন্যাল: যদি ভুল সিগন্যালের উপর ভিত্তি করে নির্দিষ্ট লেভেলের কাছাকাছি দুটি বা ততোধিক পজিশন খোলা হয় (যা টেক প্রফিট শুরু করেনি বা নিকটতম লক্ষ্যমাত্রায় পৌছায়নি), তাহলে এই লেভেলে প্রাপ্ত পরবর্তী সমস্ত সিগন্যাল উপেক্ষা করা উচিত।
3) ফ্ল্যাট মার্কেট: ফ্ল্যাট মার্কেটের সময়, যেকোন পেয়ারের একাধিক ফলস সিগন্যাল তৈরি হতে পারে বা কোন সিগন্যালের গঠন নাও হতে পারে। যাই হোক না কেন, ফ্ল্যাট মুভমেন্টের ইঙ্গিত পাওয়া মাত্র ট্রেডিং বন্ধ করে দেয়া উচিত।
4) ট্রেডিং টাইমফ্রেম: ইউরোপীয় সেশনের শুরু এবং মার্কিন সেশনের মাঝামাঝি সময়ে ট্রেড ওপেন করা উচিত। এর বাইরে সমস্ত ট্রেড ম্যানুয়ালি ক্লোজ করতে হবে।
5) MACD সূচকের সিগন্যাল: প্রতি ঘন্টার চার্টে, শুধুমাত্র উল্লেখযোগ্য ভোলাট্যালিটি এবং প্রতিষ্ঠিত প্রবণতার মধ্যেই MACD থেকে প্রাপ্ত সিগন্যালের উপর ভিত্তি করে ট্রেড করার পরামর্শ দেওয়া হয়, যা একটি ট্রেন্ডলাইন বা ট্রেন্ড চ্যানেল দ্বারা নিশ্চিত করা হয়।
6) কাছাকাছি লেভেল: যদি দুটি লেভেল একে অপরের খুব কাছাকাছি অবস্থিত হয় (5 থেকে 15 পিপস পর্যন্ত), সেগুলোকে সাপোর্ট এবং রেজিস্ট্যান্স লেভেল হিসাবে বিবেচনা করা উচিত।
7) স্টপ লস: মূল্য 15 পিপস উদ্দেশ্যমূলক দিকে যাওয়ার পর, ব্রেক-ইভেনে স্টপ লস সেট করা উচিত।
সাপোর্ট এবং রেজিস্ট্যান্স লেভেলগুলো হল সেই লেভেল যা কারেন্সি পেয়ার কেনা বা বিক্রি করার সময় লক্ষ্যমাত্রা হিসাবে কাজ করে। আপনি এই লেভেলগুলোর কাছাকাছি টেক প্রফিট সেট করতে পারেন।
লাল লাইন হল চ্যানেল বা ট্রেন্ড লাইন যা বর্তমান প্রবণতা প্রদর্শন করে এবং দেখায় যে এখন কোন দিকে ট্রেড করা ভাল হবে।
MACD (14,22,3) সূচক, হিস্টোগ্রাম এবং সিগন্যাল লাইন উভয়ই অন্তর্ভুক্ত করে, এটি একটি সহায়ক টুল হিসেবে কাজ করে এবং এটি সিগন্যালের উৎস হিসেবেও ব্যবহার করা যেতে পারে।
গুরুত্বপূর্ণ বক্তৃতা এবং প্রতিবেদন (সর্বদা নিউজ ক্যালেন্ডারে অন্তর্ভুক্ত থাকে) যেকোন কারেন্সি পেয়ারের মূল্যের গতিশীলতাকে ব্যাপকভাবে প্রভাবিত করতে পারে। অতএব, এগুলো প্রকাশের সময় অত্যন্ত সতর্কভাবে ট্রেডিং করতে হবে। প্রচলিত প্রবণতার বিপরীতে আকস্মিকভাবে মূল্যের পরিবর্তন থেকে সুরক্ষিত থাকতে মার্কেটে থেকে বের হয়ে যাওয়াই যুক্তিসঙ্গত হতে পারে।
নতুন ট্রেডারদের সর্বদা মনে রাখতে হবে যে প্রতিটি ট্রেড থেকে লাভ হবে না। একটি সুস্পষ্ট কৌশল গ্রহণ ও কার্যকর অর্থ ব্যবস্থাপনাই দীর্ঘমেয়াদে ট্রেডিংয়ের সাফল্যের ভিত্তি হিসেবে কাজ করে।
*এখানে পোস্ট করা মার্কেট বিশ্লেষণ আপনার সচেতনতা বৃদ্ধির জন্য প্রদান করা হয়, ট্রেড করার নির্দেশনা প্রদানের জন্য প্রদান করা হয় না।
ইন্সটাফরেক্স বিশ্লেষণমূলক পর্যালোচনাগুলো আপনাকে মার্কেট প্রবণতা সম্পর্কে পুরোপুরি সচেতন করবে! ইন্সটাফরেক্সের একজন গ্রাহক হওয়ায়, দক্ষ ট্রেডিং এর জন্য আপনাকে অনেক সেবা বিনামূল্যে প্রদান করা হয়।


