


Нашият екип има над 7 000 000 търговци!
Всеки ден работим заедно, за да подобрим търговията. Получаваме високи резултати и напредваме.
Признанието от милионите търговци по целия свят е най-доброто признание за нашата работа! Направихте своя избор и ние ще направим всичко, което е необходимо, за да отговорим на вашите очаквания!
Ние сме един страхотен екип заедно!
ИнстаФорекс. Горд съм да работя за вас!


Актьор, шампион на UFC 6 турнира и истински герой!
Човекът, който изгради себе си. Човекът, който върви по пътя ни.
Тайната зад успеха на Тактаров е постоянно движение към целта.
Открийте всички страни на вашия талант!
Откривайте, опитвайте, проваляйте се - но никога не спирайте!
ИнстаФорекс. Вашата успешна история започва тук!

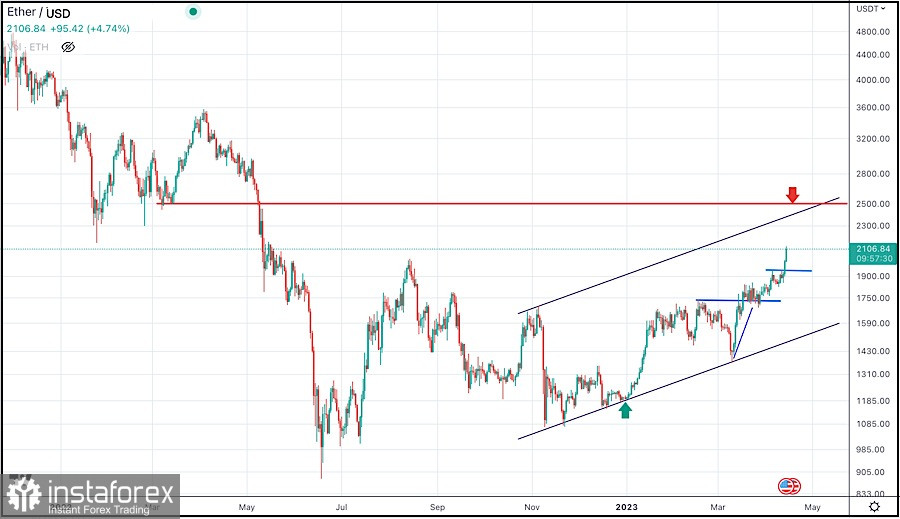
Ethereum has been one of the best-performing cryptocurrencies in the market, with significant gains since the beginning of the year. The recent technical analysis of the Ethereum/USD chart shows a potential bullish trend in the near future.
The updated technical analysis of the Ethereum/USD chart indicates that Ethereum has broken out of a key resistance level against USD, which could lead to further gains.
The cryptocurrency is trading within an ascending channel on the USD chart, signaling a potential bullish move.
Ethereum is trading above its 50-day moving average, indicating a bullish trend. However, the Relative Strength Index (RSI) is approaching overbought levels, which indicates a potential correction.
Hence, Ethereum may experience a pullback before continuing its upward trend against USD.
Traders should keep an eye on the price action around the 2500$ level, as it is a key resistance level. A break above this level could lead to further gains towards the 3000$ level. Conversely, a break below the 2000 $ support level could lead to a short-term bearish trend.
In summary, Ethereum against USD chart points to further continuation of the ongoing bullish trend, with a key resistance level at 2500.
Traders should be cautious and wait for confirmation of the bullish trend before entering any long positions.
*Анализът на пазара публикуван тук има за цел да повиши информираността Ви, но не и да дава указания за търговия.
Аналитичните прегледи на ИнстаФорекс ще ви запознаят изцяло с пазарните тенденции! Като клиент на ИнстаФорекс, на вас се предоставят голям брой безплатни услуги за ефикасна търговия.


