


Нашият екип има над 7 000 000 търговци!
Всеки ден работим заедно, за да подобрим търговията. Получаваме високи резултати и напредваме.
Признанието от милионите търговци по целия свят е най-доброто признание за нашата работа! Направихте своя избор и ние ще направим всичко, което е необходимо, за да отговорим на вашите очаквания!
Ние сме един страхотен екип заедно!
ИнстаФорекс. Горд съм да работя за вас!


Актьор, шампион на UFC 6 турнира и истински герой!
Човекът, който изгради себе си. Човекът, който върви по пътя ни.
Тайната зад успеха на Тактаров е постоянно движение към целта.
Открийте всички страни на вашия талант!
Откривайте, опитвайте, проваляйте се - но никога не спирайте!
ИнстаФорекс. Вашата успешна история започва тук!

Selling pressure in the US dollar index pushed it below the important resistance levels opening the way for a move towards 95-94. The trend is clearly bearish on all time frames.
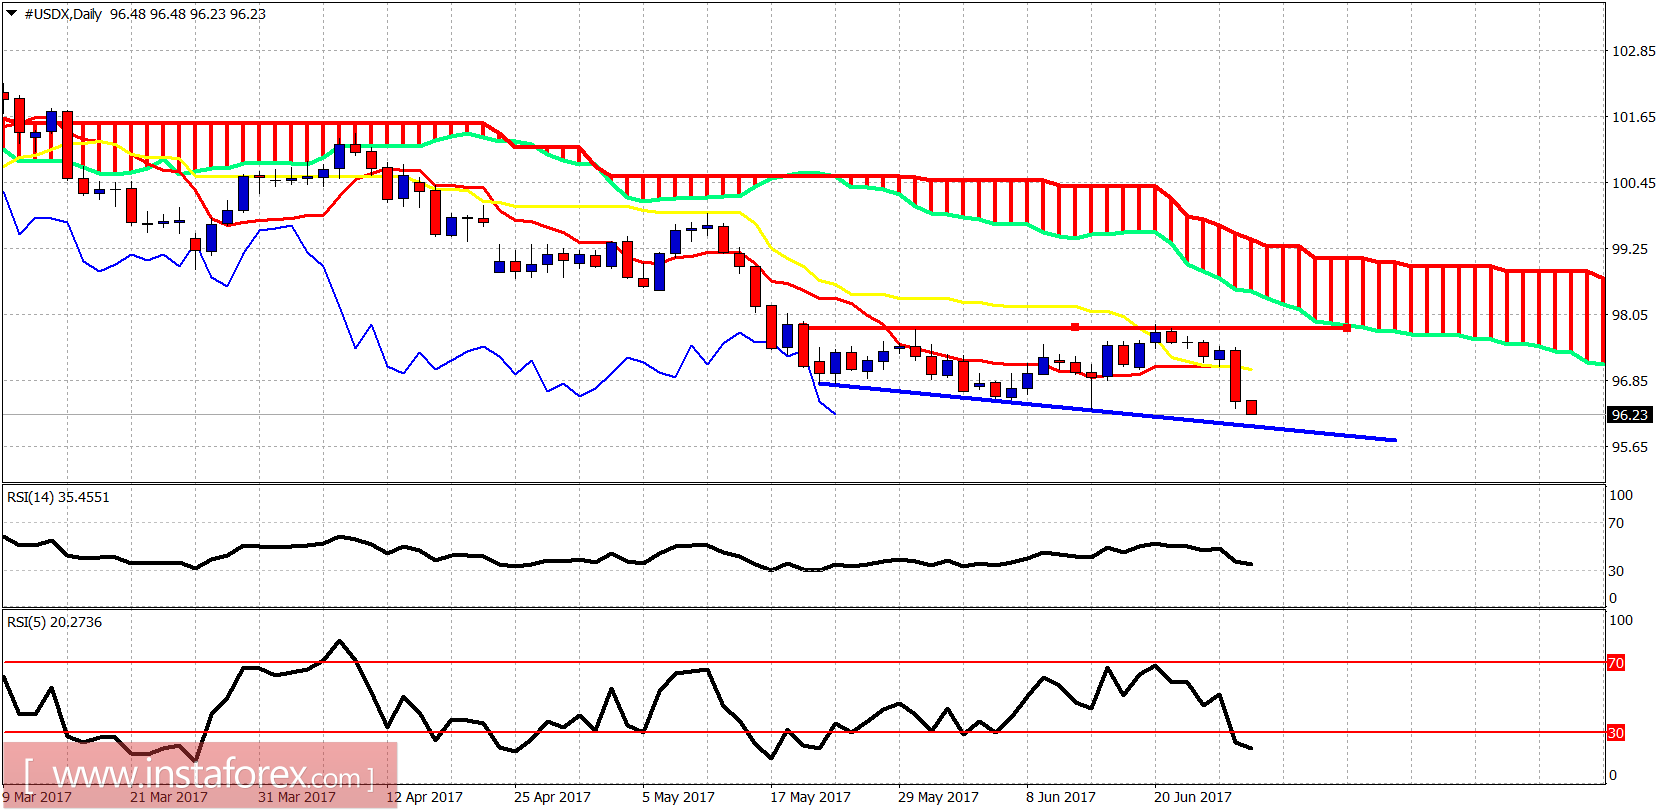
Blue line - support
Price has broken below the Tenkan- and Kijun-Sen on the daily chart. The index has been forming something like a megaphone for the last few weeks and this provides a support at 95.70. However, I believe that the move that started just below 98 last week is not going to stop there but much lower. The consolidation of the last few weeks is being broken downwards.
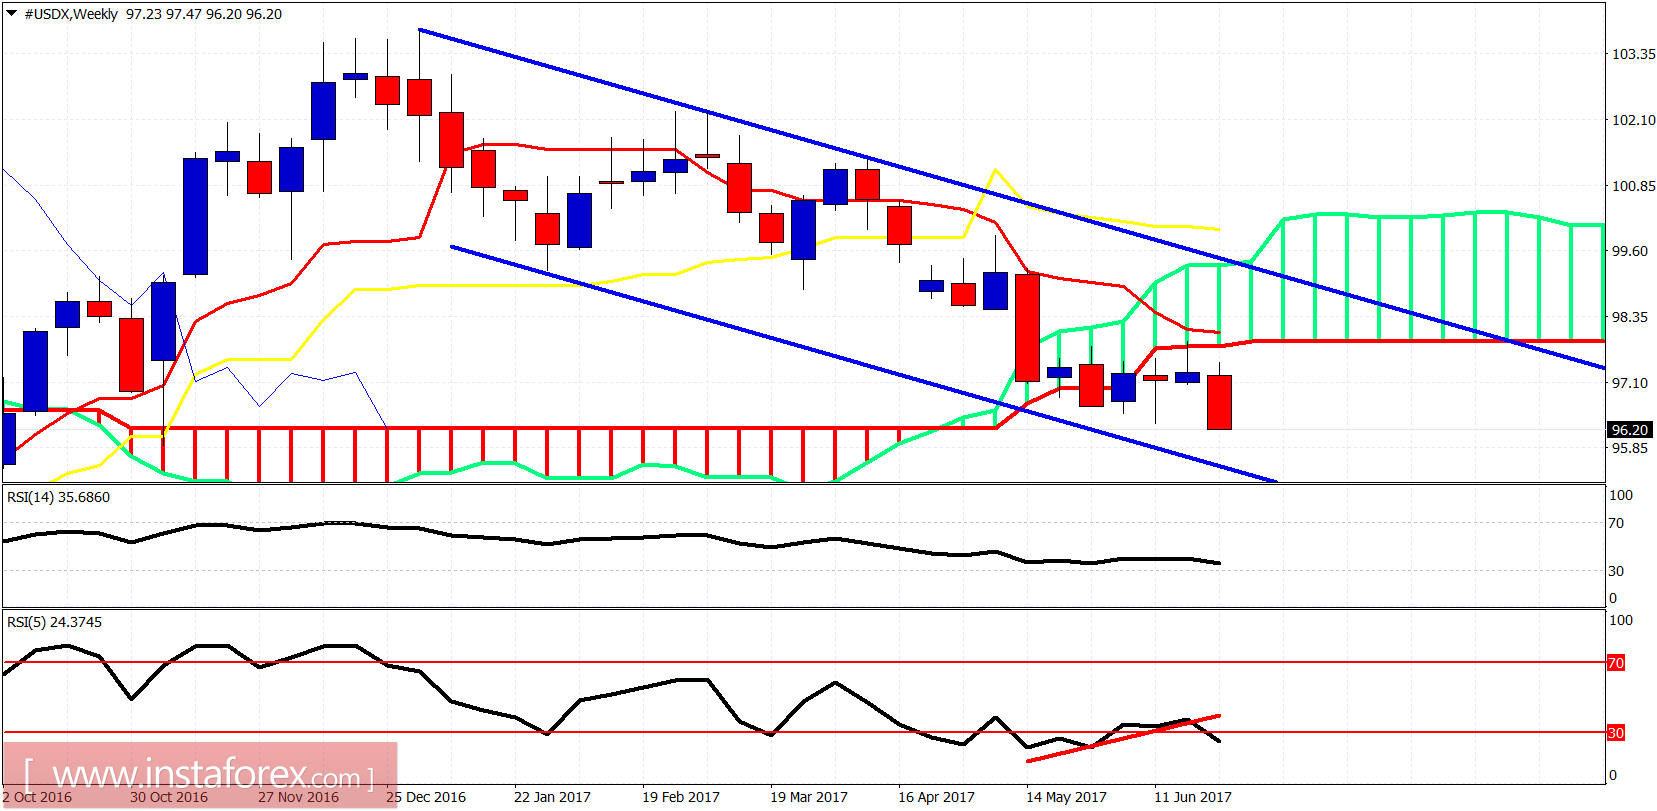
The rejection from the Ichimoku cloud was a stronger bearish signal than the bullish divergence by the RSI(5). The trend remains bearish as a new weekly low is made. We have to wait and see if the RSI indicators provide a new low or a new divergence.
*Анализът на пазара публикуван тук има за цел да повиши информираността Ви, но не и да дава указания за търговия.
Аналитичните прегледи на ИнстаФорекс ще ви запознаят изцяло с пазарните тенденции! Като клиент на ИнстаФорекс, на вас се предоставят голям брой безплатни услуги за ефикасна търговия.
Your IP address shows that you are currently located in the USA. If you are a resident of the United States, you are prohibited from using the services of InstaFintech Group including online trading, online transfers, deposit/withdrawal of funds, etc.
If you think you are seeing this message by mistake and your location is not the US, kindly proceed to the website. Otherwise, you must leave the website in order to comply with government restrictions.
Why does your IP address show your location as the USA?
Please confirm whether you are a US resident or not by clicking the relevant button below. If you choose the wrong option, being a US resident, you will not be able to open an account with InstaSpot anyway.
We are sorry for any inconvenience caused by this message.


