Действителни модели

Моделите са графични схеми, които се формират върху ценовата графика. Според един от техническите анализи, историята (движението на цените) се повтаря. Това означава, че движенията на цените често са сходни в същите ситуации, което дава възможност да се предскаже по-нататъшното развитие на ситуацията с голяма вероятност.
Подходящите модели от ИнстаФорекс е лесна за използване услуга, която ви позволява да сте наясно с последните промени на пазара и да реагирате на знаците от пазара навреме. В нашата услуга винаги ще намерите най-новите и най-подходящите модели за всяка двойка и всяка времева рамка.
Bullish Symmetrical Triangle
was formed on 01.04 at 10:36:33 (UTC+0)
signal strength 3 of 5

According to the chart of M30, EURUSD formed the Bullish Symmetrical Triangle pattern. Description: This is the pattern of a trend continuation. 1.0849 and 1.0777 are the coordinates of the upper and lower borders respectively. The pattern width is measured on the chart at 72 pips. Outlook: If the upper border 1.0849 is broken, the price is likely to continue its move by 1.0844.
- All
- All
- Bullish Rectangle
- Bullish Symmetrical Triangle
- Bullish Symmetrical Triangle
- Double Bottom
- Double Top
- Double Top
- Triple Top
- Triple Top
- Triple Top
- Triple Top
- All
- All
- Buy
- Sale
- All
- 1
- 2
- 3
- 4
- 5
Trojitý vrchol
was formed on 16.04 at 20:00:08 (UTC+0)
signal strength 3 of 5

Vzor Trojitý vrchol se vytvořil na grafu M30 u nástroje #MA. Charakteristika vzoru: okraje mají rostoucí úhel; spodní linie vzoru má souřadnice 508.17/512.83 s horní hranicí 523.81/521.51; průmět šířky činí
Open chart in a new window
Dvojité dno
was formed on 16.04 at 19:45:07 (UTC+0)
signal strength 2 of 5
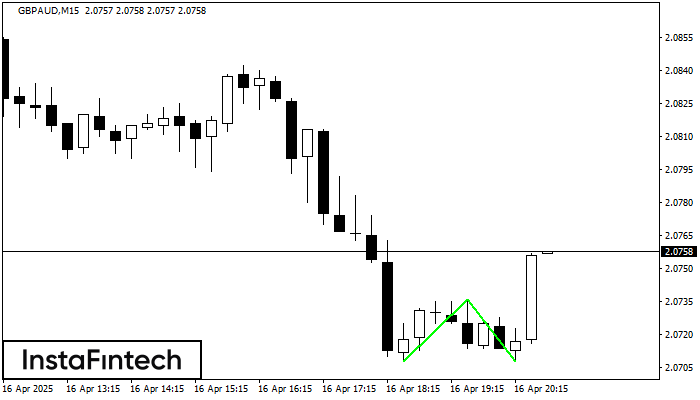
Vzor Dvojité dno se vytvořil na grafu M15 u nástroje GBPAUD; horní hranice je 2.0736; spodní hranice je 2.0708. Šířka vzoru je 28 bodů. V případě průlomu horní hranice 2.0736
Časové rámce M5 a M15 mohou mít více falešných vstupních bodů.
Open chart in a new window
Dvojité dno
was formed on 16.04 at 19:30:25 (UTC+0)
signal strength 1 of 5
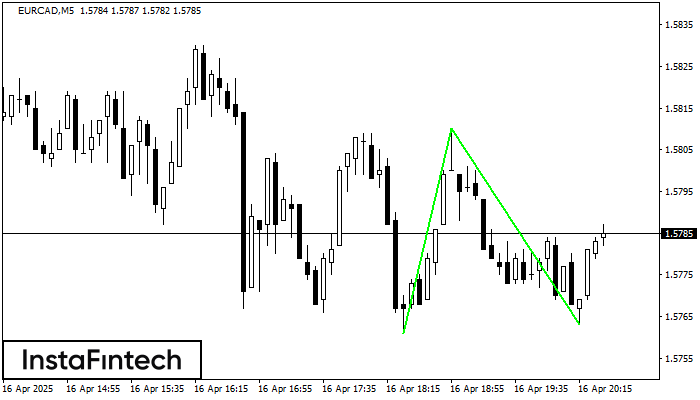
Vzor Dvojité dno se vytvořil na grafu M5 u nástroje EURCAD; horní hranice je 1.5810; spodní hranice je 1.5763. Šířka vzoru je 49 bodů. V případě průlomu horní hranice 1.5810
Časové rámce M5 a M15 mohou mít více falešných vstupních bodů.
Open chart in a new window