


我们的团队有超过700万的操盘手!
我们每天都在一起努力改善交易。我们得到了很高的成绩,并继续前进。
世界各地数以百万计的操盘手的认可是我们工作的最大赞赏! 您做出了您的选择,我们将尽一切努力来满足您的期望!
我们是一个共同的伟大团队!
InstaSpot. 自豪地为您工作!


4h
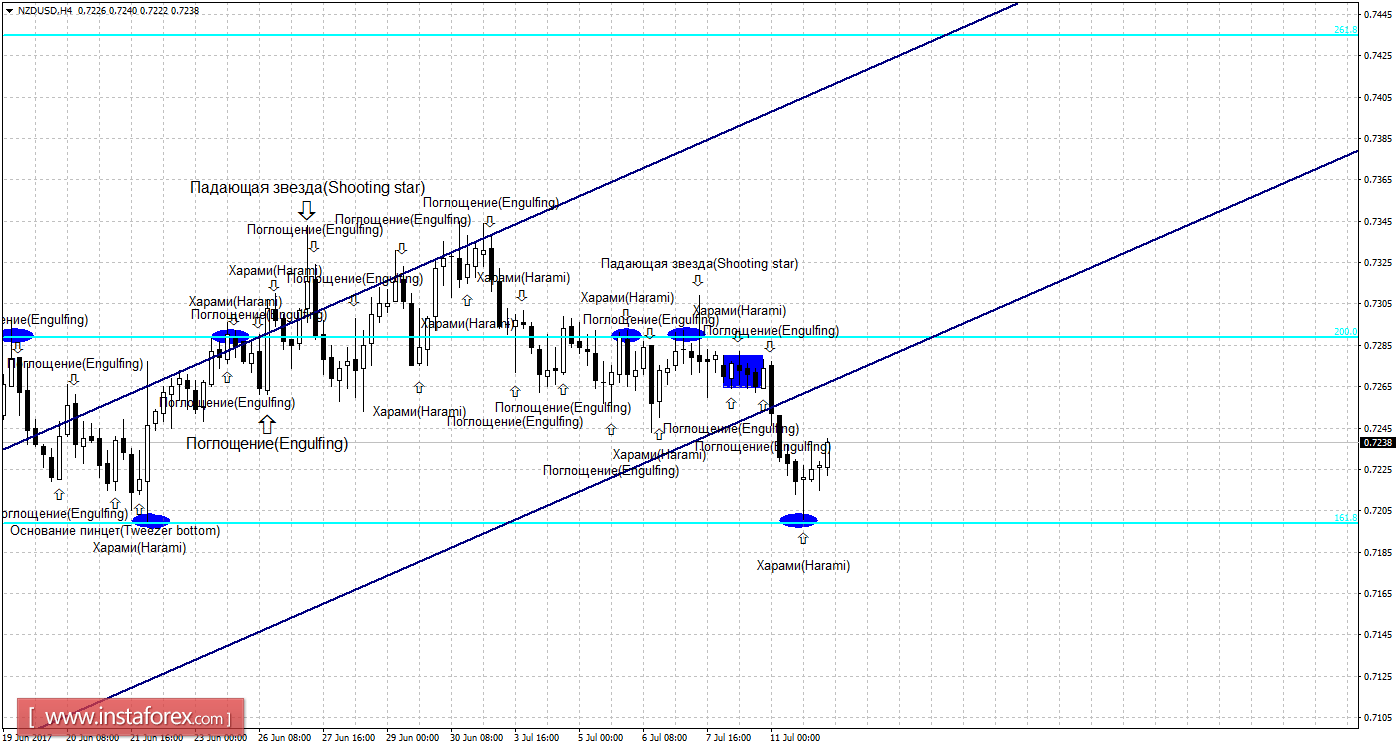
Prices hang up from the correction level of 161.8% to 0.7199 and the formation of bullish Harami candlestick pattern are working in favor of the New Zealand currency.
The expansion started in the direction of the corrective level of 200.0% - 0.7289.
The NZD / USD consolidated below the correction level of 161.8% which will increase chances of further decline in prices towards the next corrective level of 100.0% - 0.7053.
The Fibonacci grid is placed on extremes from April 24, 2017 and May 11, 2017.
Daily
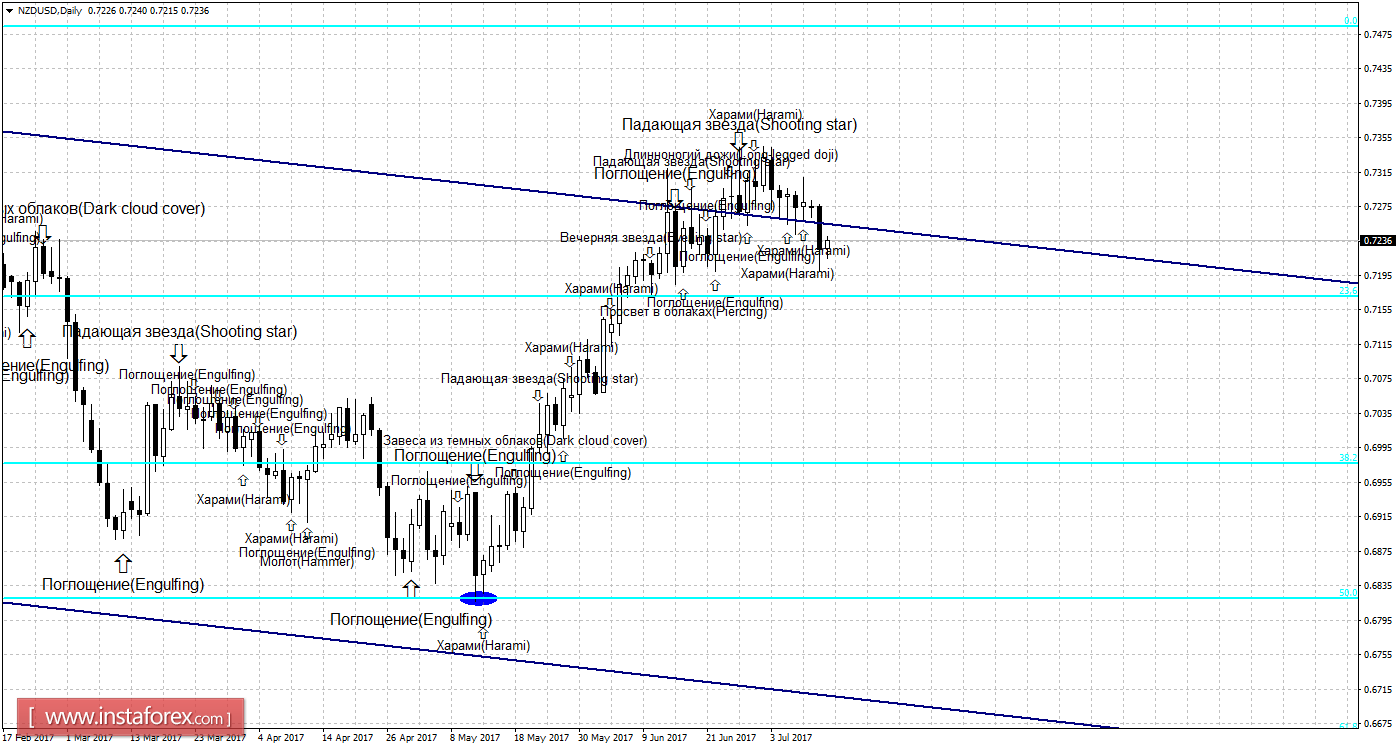
The weakening of the NZD / USD pair continues as shown the 24-hour chart towards the direction of the correction level of 23.6% - 0.7172. The pair's retracement level of 23.6% is expected to allow traders make a move favorable to the New Zealand currency and some development approaching the correction level of 0.0% - 0.7484. The formation of the bullish candle pattern will also work inclined with the initial growth of the pair. The pair consolidated below the Fibo level of 23.6% had increased chances of continuing the decline towards the next correction level of 38.2% - 0.6977.
The Fibonacci grid is located on extremes from August 24, 2015 and September 8, 2016.
Specification:
Weak candle formations will be marked with plain text and a smaller size of arrows.
Strong candle formations will be marked with bold text and a larger size of arrows.
*这里的市场分析是为了增加您对市场的了解,而不是给出交易的指示。
InstaSpot分析评论将让您充分了解市场趋势! 作为InstaSpot的客户,您将获得大量的免费服务以实现有效的交易。


