


我们的团队有超过700万的操盘手!
我们每天都在一起努力改善交易。我们得到了很高的成绩,并继续前进。
世界各地数以百万计的操盘手的认可是我们工作的最大赞赏! 您做出了您的选择,我们将尽一切努力来满足您的期望!
我们是一个共同的伟大团队!
InstaSpot. 自豪地为您工作!


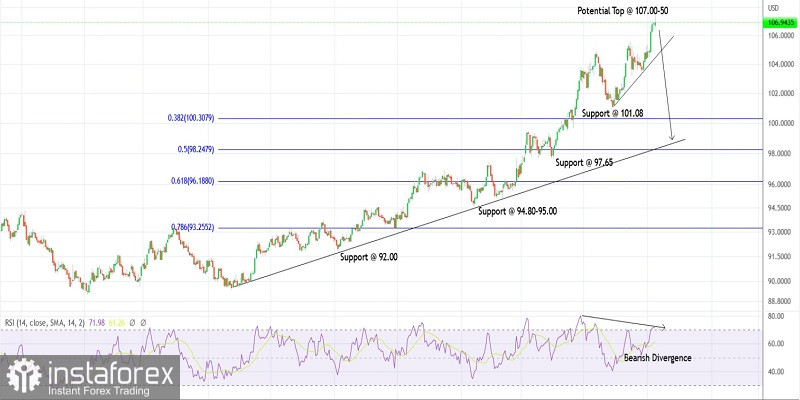
The US dollar index rose through the 107.49 high intraday on Friday before reversing sharply lower. The forecast of the last week suggested that the index would top out. The price is plotting a potential shooting star candlestick on the daily chart signalling a reversal ahead. A break below the 103.15 initial support will confirm a top and reversal as bears come back strong.
The US dollar index has rallied religiously since January 06, 2021, after hitting the 89.20 lows. The price has carved a series of higher highs and higher lows and reached 107.49, a potential top. The entire rally looks complete and ideally should be retraced at least towards the 94.00-95.00 zone, which is close to the Fibonacci 0.618 levels of the above growth.
The US dollar index has carved a recent cycle between 101.08 and 107.49 levels, with 103.15 as the median support. Also, note the immediate trend line, which is expected to break, once prices drop below 103.15. We can confirm a bearish reversal thereafter as bears target below 103.15 and 101.00 in the near term.
The US dollar index is looking well poised to resume a larger-degree corrective wave lower towards 101.00 as the initial target. It should be ideally followed by a corrective wave followed by another drag lower towards the 94.00-95.00 zone. Also, note that each high recently has been accompanied by a strong bearish divergence, which is a potential reversal signal. We shall look forward and confirm the price action over the next week.
Potential drop to 101.00 against 108.00
Good luck!
*这里的市场分析是为了增加您对市场的了解,而不是给出交易的指示。
InstaSpot分析评论将让您充分了解市场趋势! 作为InstaSpot的客户,您将获得大量的免费服务以实现有效的交易。


