


GBP/USD
Brief Analysis:
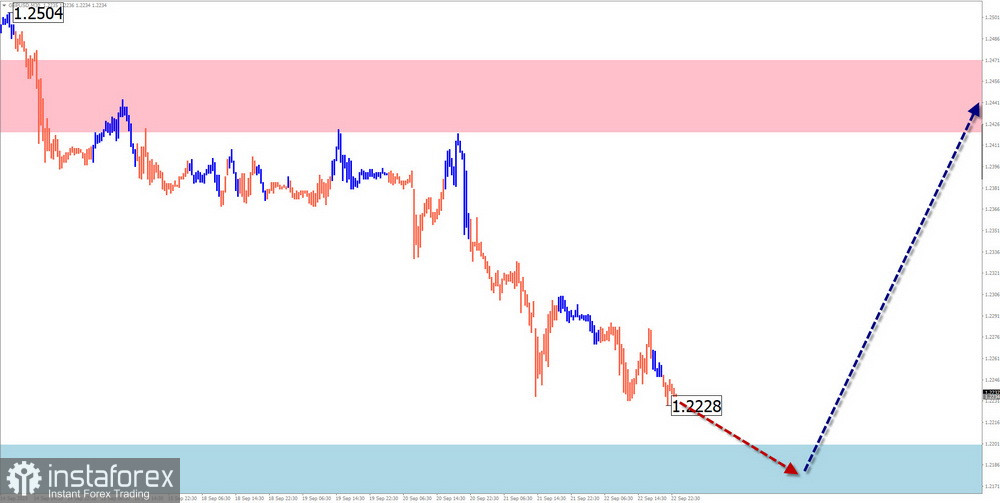
Over the last three months, the quotes of the major British pound pair have formed a downward correction to the previous trend. The price has approached the upper boundary of the potential reversal zone on the daily timeframe. The structure of the current wave does not indicate completion. To break through and continue the decline, it is necessary to elevate its level in the counter correction.
Weekly Forecast:
In the next few days, a gradual transition of the current decline of the British pound into a sideways trend is expected. In the second half of the week, a reversal and the beginning of a price increase can be anticipated.
Potential Reversal Zones
Resistance:
Support:
Recommendations
Selling: Fractional lots are possible in separate trading sessions. They have limited potential.
Buying: Recommended after the appearance of confirmed signals in the support zone, confirmed by your trading system, for opening trades.
AUD/USD
Brief Analysis:
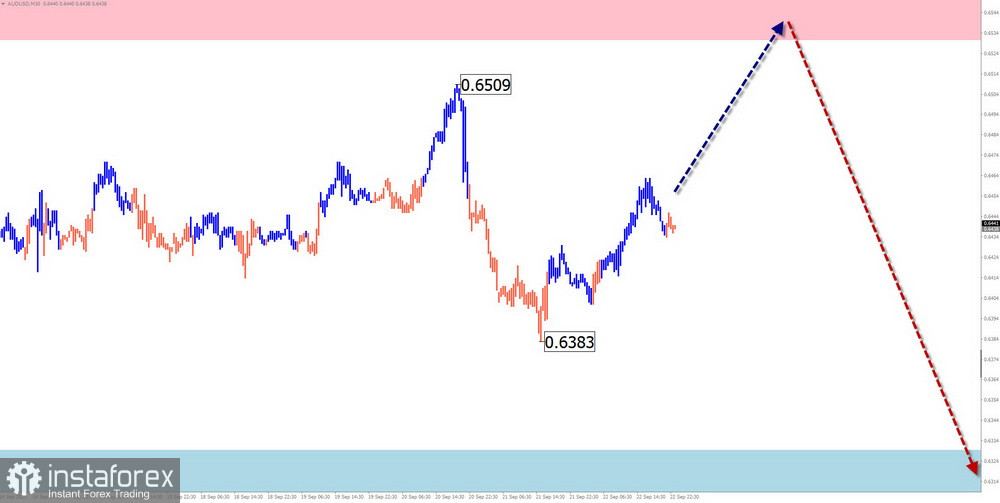
The direction of the Australian dollar trend since February is defined by a descending wave. The unfinished segment along the main course counts from July 14. In its structure, a correction of a hidden type is forming along strong support, where the final part has not been completed.
Weekly Forecast:
In the coming days, upward movement is expected until the price increase in the resistance zone is completed. By the end of the week, a reversal and a repeat price decline to the calculated support levels can be expected.
Potential Reversal Zones
Resistance:
Support:
Recommendations
Buying: Fractional lots may be used within intraday trading.
Selling: This will become possible after confirmed reversal signals appear in the resistance zone.
USD/CHF
Brief Analysis:
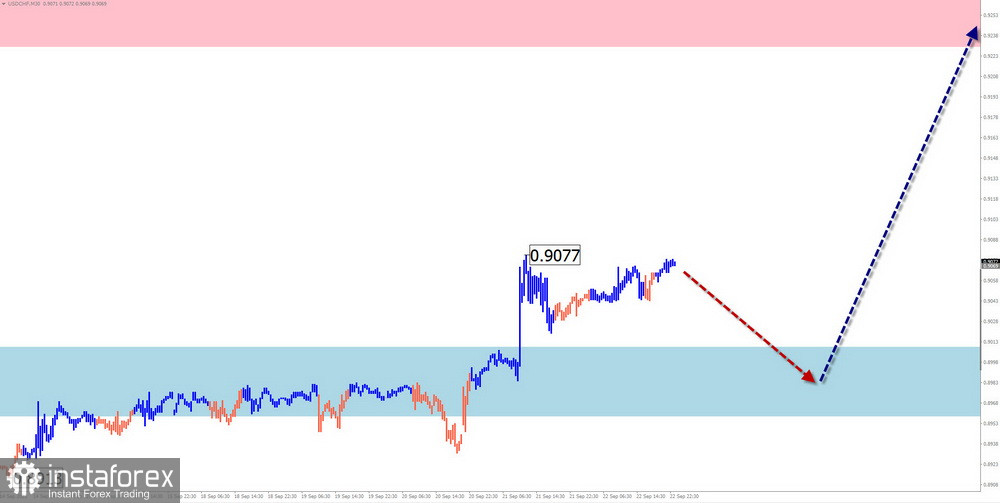
The ascending wave of the Swiss franc major pair, which started on July 14, sets the direction for the short-term trend of the pair. The wave is developing impulsively. After breaking through the intermediate resistance last week, the path is open for further ascent to the next level. Before continuing the trend, the price must increase its wave level in the correction.
Weekly Forecast:
A flat setting of price oscillations along the support zone is expected at the beginning of the upcoming week. Afterward, a resumption of the course's growth can be anticipated. The price increase is likely up to the resistance zone.
Potential Reversal Zones
Resistance:
Support:
Recommendations
Selling: There will be no market conditions for such transactions in the coming days.
Buying: This may be used after the appearance of buying signals in the support zone, confirmed by the trading systems you use.
EUR/JPY
Brief Analysis:
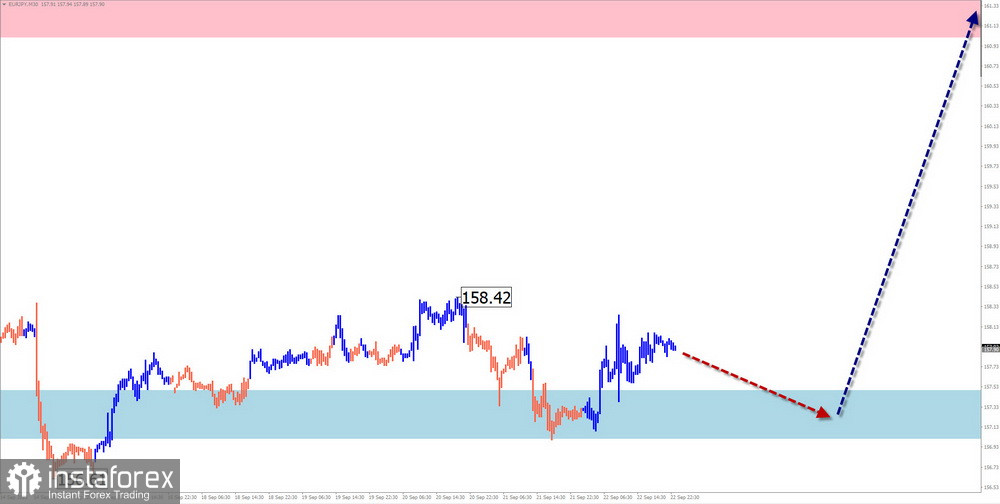
The dominant bullish trend has brought the Euro-Japanese Yen cross pair's quotes to a powerful potential reversal zone on the weekly chart. As of the analysis date, the last unfinished segment of the trend counts from July 28. A corrective part of the movement (B) has been forming in a sideways flat for the past month. After its completion, a price increase towards the final part (C) is expected.
Weekly Forecast:
In the first half of the week, the continuation of sideways price fluctuations along support levels is expected. In the second half, an increase in volatility, a reversal, and the beginning of an active price increase can be expected. The time of important news releases can serve as a reference point.
Potential Reversal Zones
Resistance:
Support:
Recommendations
Selling: These have a high risk and may result in losses.
Buying: To trade this pair, you should wait for the appearance of corresponding signals from the trading systems you use.
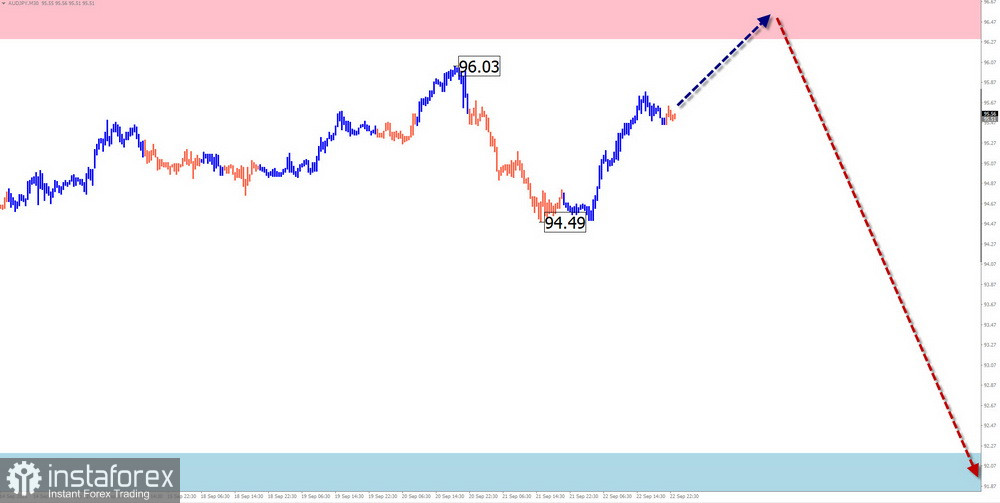
AUD/JPY
Brief Analysis:
Since the end of March this year, the quotes of the Australian Dollar/Japanese Yen cross pair have been primarily moving sideways. On a larger scale, this segment forms a correctional flat on the chart. An analysis of the structure shows the absence of the final part.
Weekly Forecast:
An upward vector is expected at the beginning of the week, with a price increase to the resistance zone. Further, in this zone, conditions for a reversal can be expected. The beginning of a decline is likely by the end of the week.
Potential Reversal Zones
Resistance:
Support:
Recommendations
Buying: These have limited potential and may lead to losses.
Selling: These may be used in trading after the appearance of reversal signals in the resistance zone.
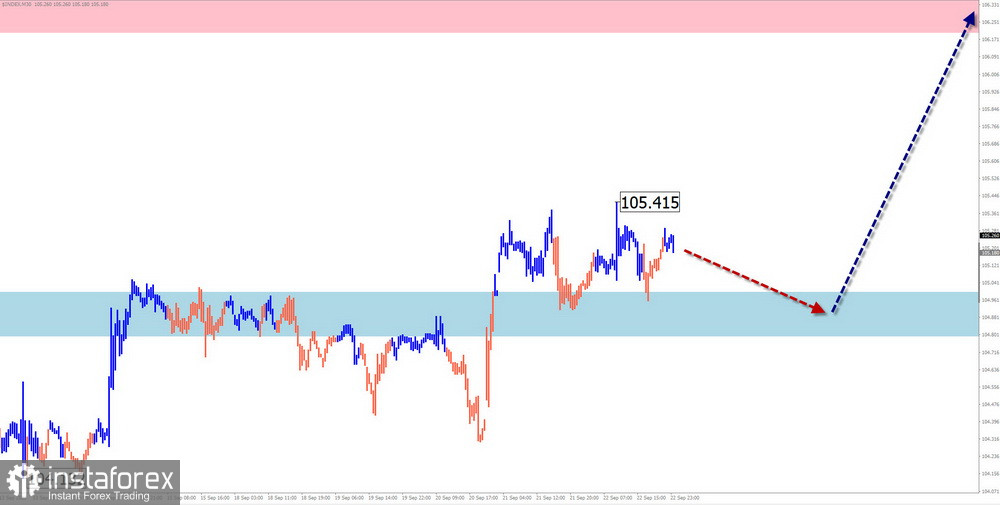
US Dollar Index
Brief Analysis:
The ascending wave on the US Dollar Index chart, which began in mid-July, has given a new direction to the short-term trend of the instrument. Last week, quotes pushed through the intermediate resistance level, turning it into support. After a brief correction period, the index's rise will continue.
Weekly Forecast:
A flat setting of price oscillations along the support zone is expected at the beginning of the upcoming week. Temporary pressure and a brief penetration of its lower boundary are not excluded. The resumption of the exchange rate increase is more likely closer to the weekend.
Potential Reversal Zones
Resistance:
Support:
Recommendations
The period of the US dollar's weakening will not last long. Maintaining short positions relative to national currencies in major pairs is optimal.
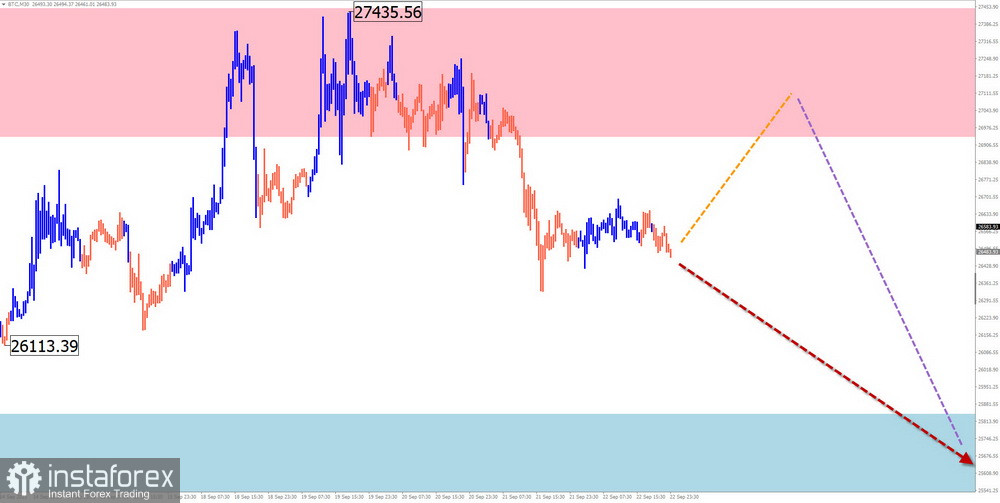
Bitcoin
Analysis:
On the Bitcoin chart, the trend direction has been set by the ascending wave algorithm since November 9 last year. Over the last four months, quotes have formed a descending correction, which is still incomplete.
Forecast:
A smooth movement of the coin's price towards the support boundaries is expected throughout the upcoming weekly period. At the beginning of the week, a price bounce in the calculated resistance zone is possible.
Potential Reversal Zones
Resistance:
Support:
Recommendations
Buying: Fractional lots may be used within intraday trading. The potential is limited by resistance.
Selling: These will become profitable in trading the instrument after confirmed reversal signals appear in the resistance zone.
Explanations: In simplified wave analysis (SWA), all waves consist of 3 parts (A-B-C). The last unfinished wave is analyzed on each timeframe (TF). Dashed lines show expected movements.
Note: The wave algorithm does not account for the duration of instrument movements over time!
*这里的市场分析是为了增加您对市场的了解,而不是给出交易的指示。
InstaSpot分析评论将让您充分了解市场趋势! 作为InstaSpot的客户,您将获得大量的免费服务以实现有效的交易。


