


我们的团队有超过700万的操盘手!
我们每天都在一起努力改善交易。我们得到了很高的成绩,并继续前进。
世界各地数以百万计的操盘手的认可是我们工作的最大赞赏! 您做出了您的选择,我们将尽一切努力来满足您的期望!
我们是一个共同的伟大团队!
InstaSpot. 自豪地为您工作!


EUR/USD
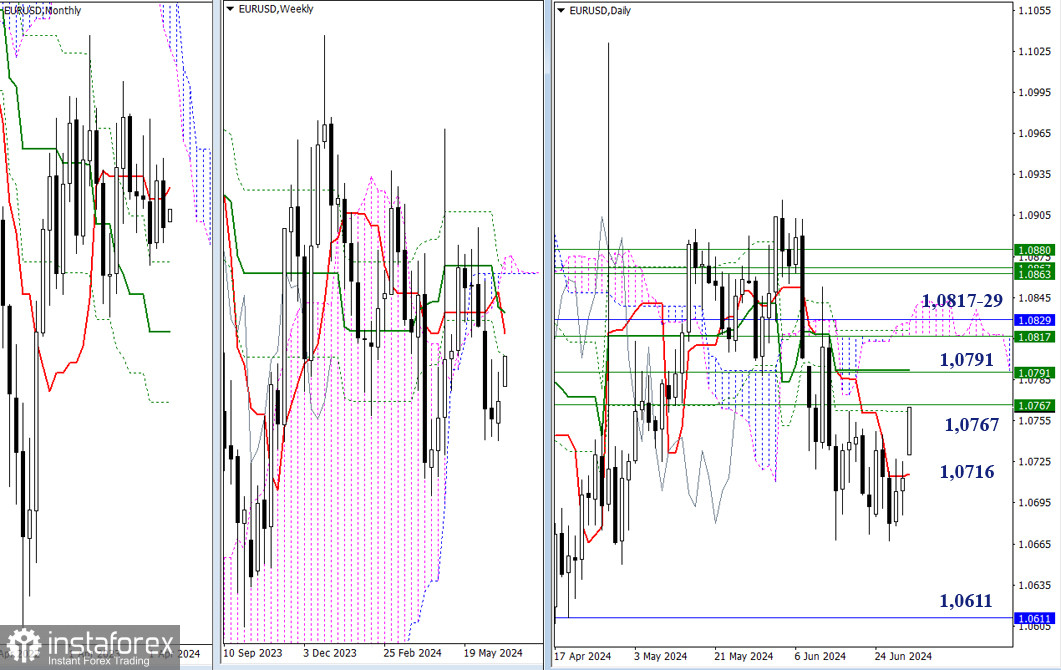
Higher timeframes
Earlier, the market remained in a state of uncertainty. With the start of a new week and month, a significant bullish gap has formed, followed by a sustained rise from EUR/USD. Currently, the pair has reached the resistances of the daily (1.0762) and weekly (1.0767) Fibonacci Kijun levels. If the pair continues to rise and the pair breaks through these resistances, the next target will be the 1.0791 mark, which currently combines the daily mid-term trend and the weekly short-term trend. After this, the bulls will be drawn to the cluster of levels around 1.0817-29 (weekly mid-term trend + monthly short-term trend + daily cloud). Under current conditions, the bears must break through the support of the daily short-term trend (1.0718) and test the low (1.0667).
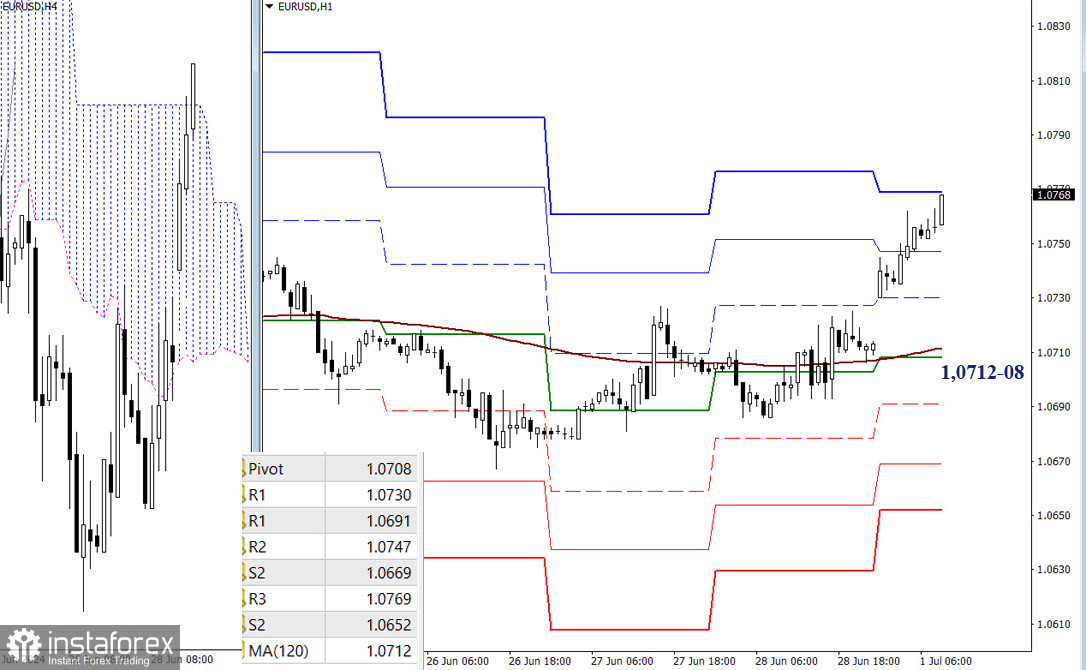
H4 – H1
The bulls currently have the main advantage on the lower time frames, as they demonstrate a successful rise. Thanks to this, buyers are now testing the final resistance of the classic Pivot levels (1.0769). If the pair continues to rise, the focus will shift to targets on the higher time frames. Targets on the lower time frame will become relevant again if the pair declines and the bears re-enter the market. The classic Pivot levels may act as support levels, and the current balance of power may change with a breakthrough of the weekly long-term trend (1.0712).
***
GBP/USD
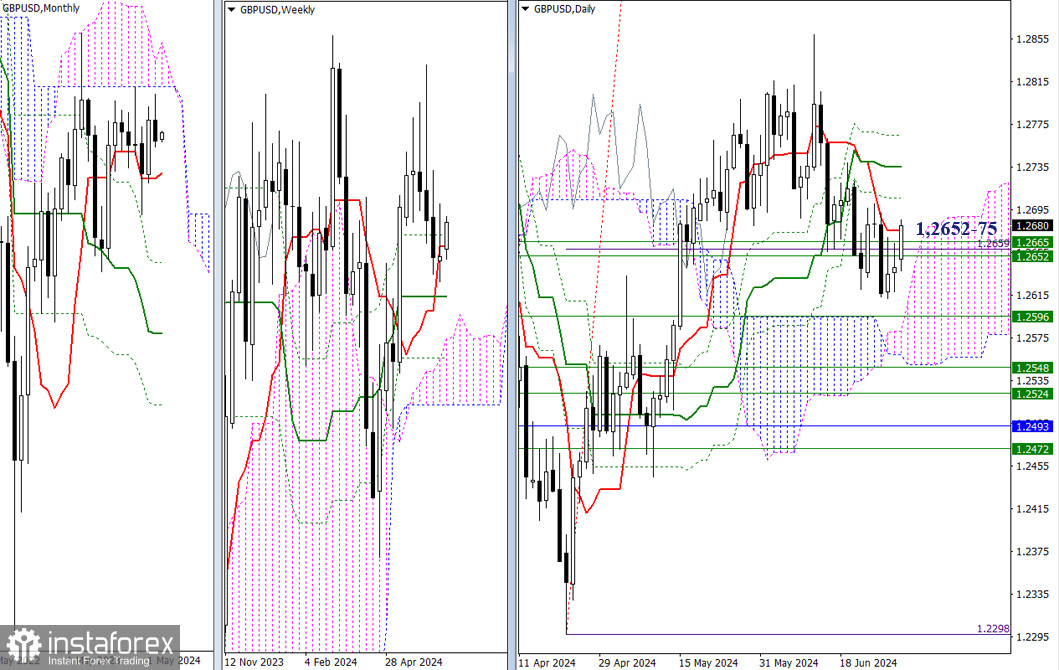
Higher timeframes
GBP/USD ended the previous month in the area of uncertainty and consolidation. The weekly and daily time frames are forming and confirming the monthly sentiment. Currently, there is interaction with the weekly levels (1.2652-65) and the daily short-term trend (1.2675). The outcome will determine the further development of events. If the bulls prevail, the market will initially focus on overcoming the resistances of the daily Ichimoku dead cross (1.2706 – 1.2736 – 1.2765). However, if the bearish bias proves stronger and the pair returns below the weekly levels (1.2652-65), then the area of 1.2608 – 1.2596 (upper boundary of the daily cloud + weekly mid-term trend) will become significant.
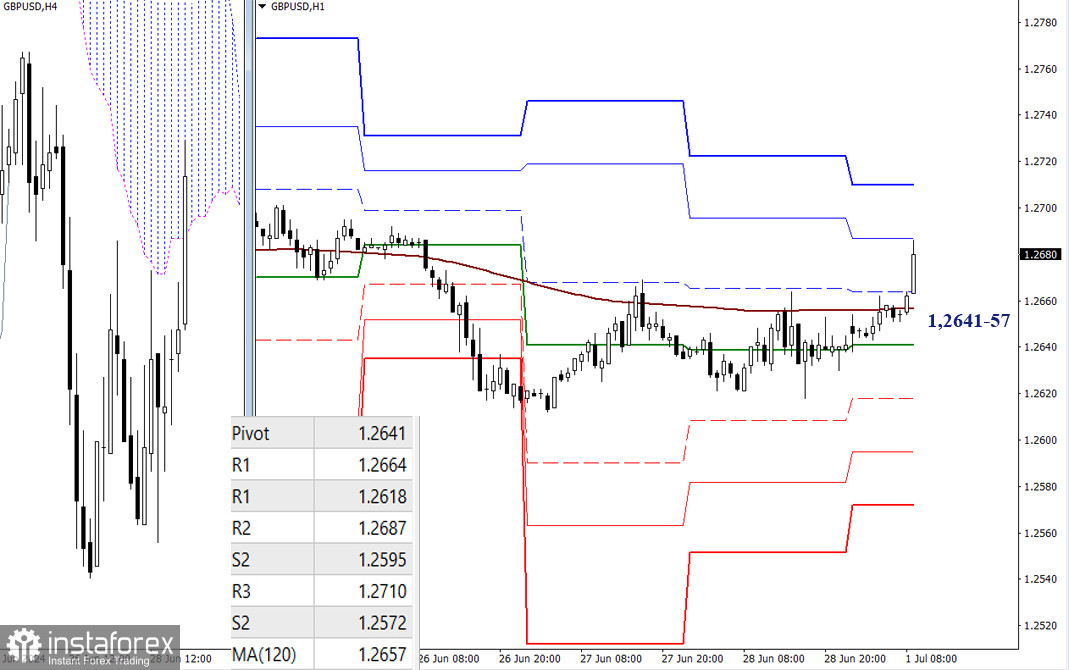
H4 – H1
On the lower time frames, the bulls have taken control of the weekly long-term trend and are developing an upward movement. The second resistance of the classical Pivot levels (1.2687) is currently being tested. The next upward target will be R3 (1.2710) and the resistances of the higher time frames. To change the current balance of power, the market must return to the key levels, which are located at 1.2657 (weekly long-term trend) – 1.2641 (central Pivot level of the day), and firmly consolidate below them.
***
The technical analysis of the situation uses:
Higher timeframes - Ichimoku Kinko Hyo (9.26.52) + Fibonacci Kijun levels
Lower timeframes - H1 - Pivot Points (classic) + Moving Average 120 (weekly long-term trend)
*这里的市场分析是为了增加您对市场的了解,而不是给出交易的指示。
InstaSpot分析评论将让您充分了解市场趋势! 作为InstaSpot的客户,您将获得大量的免费服务以实现有效的交易。


