实际模式

模式是通过价格在图表中形成的图形模型。 根据其中一项技术分析规定,历史(价格变动)重演。 这意味着价格变动在相同的情况下通常是相似的,这使得有可能以高概率预测情况的进一步发展。
InstaSpot的相关模式是一款易于使用的服务,可让您了解市场的最新变化并及时对市场线索做出反应。 在我们的服务中,您始终可以在任何货币对以及任何时间范围内找到最新和最相关的模式。
Bullish Rectangle
was formed on 02.04 at 02:16:17 (UTC+0)
signal strength 1 of 5
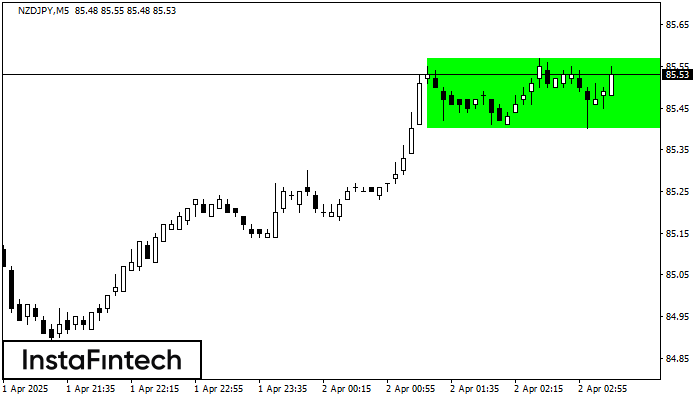
According to the chart of M5, NZDJPY formed the Bullish Rectangle which is a pattern of a trend continuation. The pattern is contained within the following borders: the lower border 85.40 – 85.40 and upper border 85.57 – 85.57. In case the upper border is broken, the instrument is likely to follow the upward trend.
The M5 and M15 time frames may have more false entry points.
- All
- All
- Bullish Rectangle
- Bullish Symmetrical Triangle
- Bullish Symmetrical Triangle
- Double Bottom
- Double Top
- Double Top
- Triple Top
- Triple Top
- Triple Top
- Triple Top
- All
- All
- Buy
- Sale
- All
- 1
- 2
- 3
- 4
- 5
Bearish Symmetrical Triangle
was formed on 07.04 at 02:45:25 (UTC+0)
signal strength 1 of 5
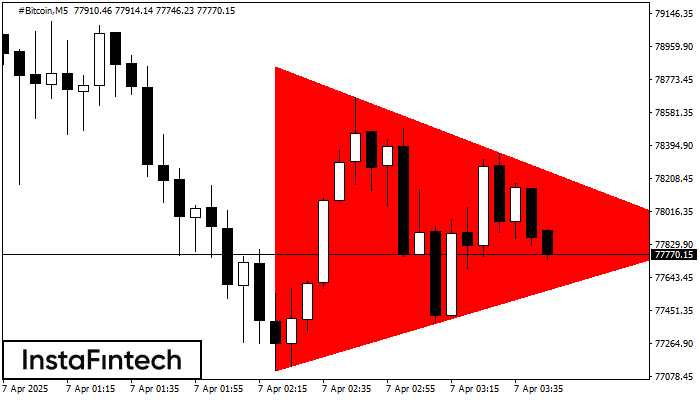
According to the chart of M5, #Bitcoin formed the Bearish Symmetrical Triangle pattern. Trading recommendations: A breach of the lower border 77111.27 is likely to encourage a continuation
The M5 and M15 time frames may have more false entry points.
Open chart in a new window
Triple Bottom
was formed on 07.04 at 02:30:15 (UTC+0)
signal strength 1 of 5
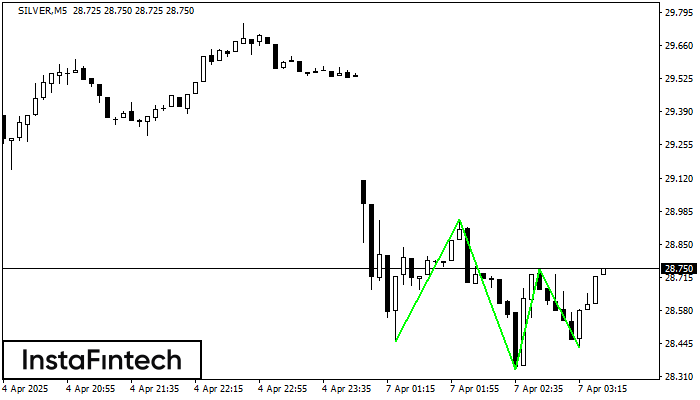
The Triple Bottom pattern has formed on the chart of SILVER M5. Features of the pattern: The lower line of the pattern has coordinates 28.95 with the upper limit 28.95/28.75
The M5 and M15 time frames may have more false entry points.
Open chart in a new window
Double Top
was formed on 07.04 at 02:30:10 (UTC+0)
signal strength 1 of 5
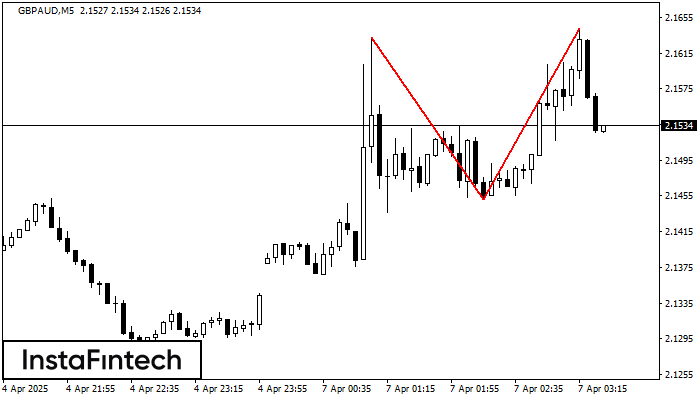
On the chart of GBPAUD M5 the Double Top reversal pattern has been formed. Characteristics: the upper boundary 2.1642; the lower boundary 2.1451; the width of the pattern 191 points
The M5 and M15 time frames may have more false entry points.
Open chart in a new window