技术分析
技术分析
定期出现在交易工具图表上并具有某种出现和发展体系的技术分析数据通常称为价格数据。


我们的团队有超过700万的操盘手!
我们每天都在一起努力改善交易。我们得到了很高的成绩,并继续前进。
世界各地数以百万计的操盘手的认可是我们工作的最大赞赏! 您做出了您的选择,我们将尽一切努力来满足您的期望!
我们是一个共同的伟大团队!
InstaSpot. 自豪地为您工作!


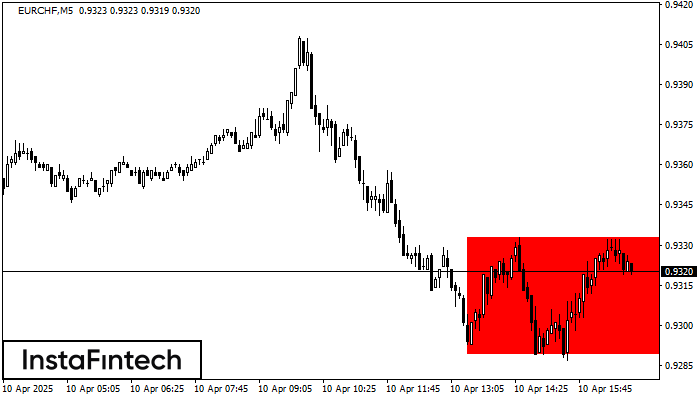
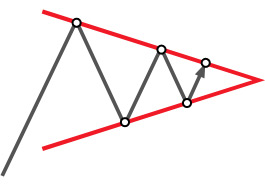
According to the chart of M5, EURCHF formed the Bearish Rectangle. This type of a pattern indicates a trend continuation. It consists of two levels: resistance 0.9333 - 0.0000
The M5 and M15 time frames may have more false entry points.
Open chart in a new window
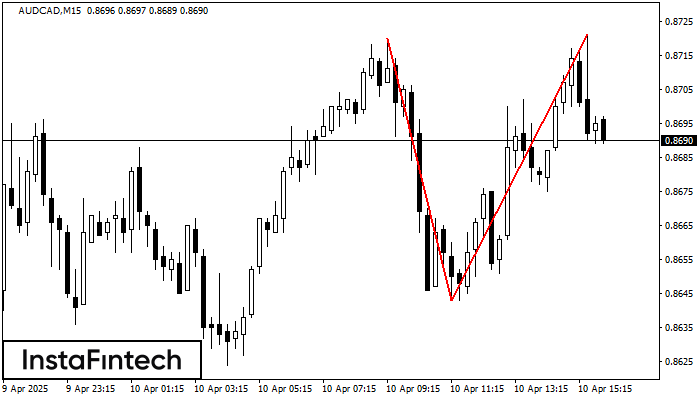
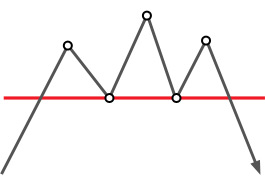
On the chart of AUDCAD M15 the Double Top reversal pattern has been formed. Characteristics: the upper boundary 0.8721; the lower boundary 0.8643; the width of the pattern 78 points
The M5 and M15 time frames may have more false entry points.
Open chart in a new window
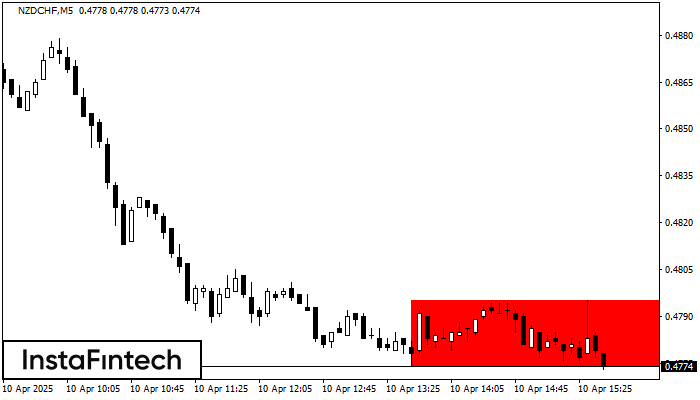
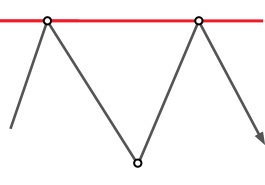
According to the chart of M5, NZDCHF formed the Bearish Rectangle. The pattern indicates a trend continuation. The upper border is 0.4795, the lower border is 0.4774. The signal means
The M5 and M15 time frames may have more false entry points.
Open chart in a new window
Your IP address shows that you are currently located in the USA. If you are a resident of the United States, you are prohibited from using the services of InstaFintech Group including online trading, online transfers, deposit/withdrawal of funds, etc.
If you think you are seeing this message by mistake and your location is not the US, kindly proceed to the website. Otherwise, you must leave the website in order to comply with government restrictions.
Why does your IP address show your location as the USA?
Please confirm whether you are a US resident or not by clicking the relevant button below. If you choose the wrong option, being a US resident, you will not be able to open an account with InstaSpot anyway.
We are sorry for any inconvenience caused by this message.