GOLDTEST ( vs ). Směnný kurz a online grafy.
Podívejte se také na
- Forecast for EUR/USD on April 2, 2025
Autor: Samir Klishi
11:23 2025-04-02 UTC+2
958
Technical analysis of EUR/USD, USD/JPY, USDX and Bitcoin.Autor: Sebastian Seliga
11:34 2025-04-02 UTC+2
883
XAU/USD. Analysis and ForecastAutor: Irina Yanina
13:22 2025-04-02 UTC+2
838
- Today, the AUD/USD pair is showing positive momentum, rebounding from nearly a four-week low.
Autor: Irina Yanina
12:25 2025-04-02 UTC+2
823
Today the USD/CAD pair is attempting to halt yesterday's decline, trying to hold above the 1.4300 level.Autor: Irina Yanina
12:22 2025-04-02 UTC+2
808
Technical analysis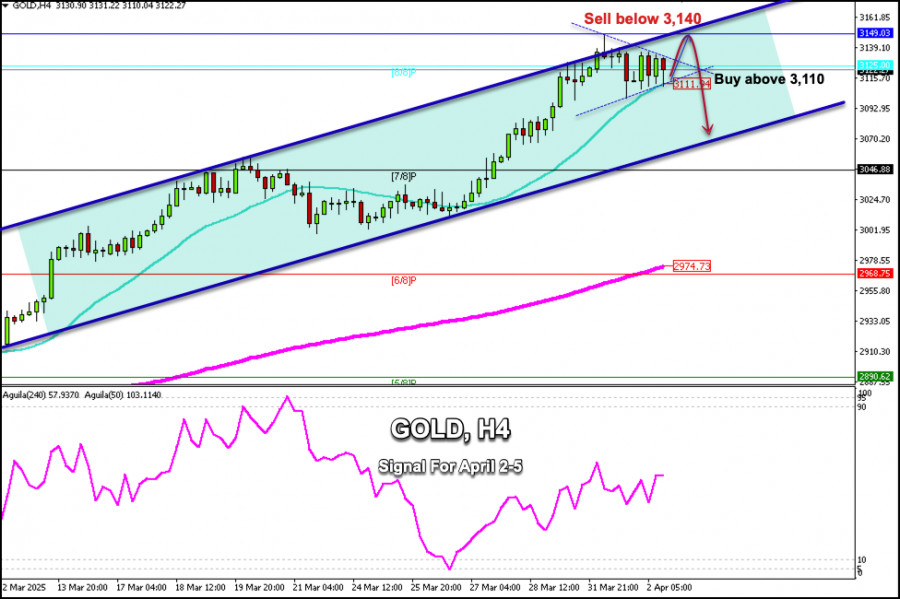
Trading Signals for GOLD (XAU/USD) for April 2-5, 2025: sell below $3,140 or buy above $3,110 (21 SMA - symmetrical triangle)
The symmetrical triangle pattern observed on the H4 chart shows that gold could experience a strong bullish impulse to reach 3,169, where resistance R_1 is located. Below this area, a technical correction could occur.Autor: Dimitrios Zappas
15:15 2025-04-02 UTC+2
748
- Market overview on April 2
Autor: Jozef Kovach
12:15 2025-04-02 UTC+2
718
The BTC/USD pair managed to halt its decline, and the current wave structure suggests a potential rise in the world's leading cryptocurrency.Autor: Chin Zhao
12:17 2025-04-02 UTC+2
688
Forecast for GBP/USD on April 2, 2025Autor: Samir Klishi
11:17 2025-04-02 UTC+2
673


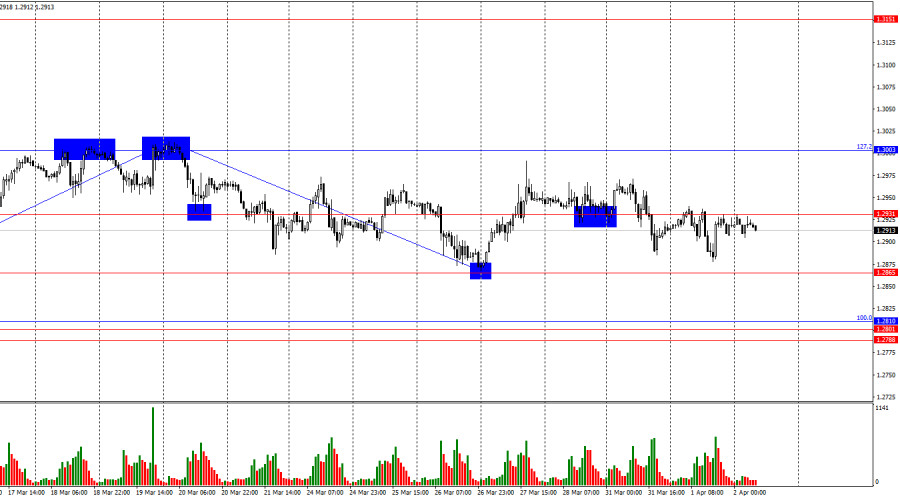
- Forecast for EUR/USD on April 2, 2025
Autor: Samir Klishi
11:23 2025-04-02 UTC+2
958
- Technical analysis of EUR/USD, USD/JPY, USDX and Bitcoin.
Autor: Sebastian Seliga
11:34 2025-04-02 UTC+2
883
- XAU/USD. Analysis and Forecast
Autor: Irina Yanina
13:22 2025-04-02 UTC+2
838
- Today, the AUD/USD pair is showing positive momentum, rebounding from nearly a four-week low.
Autor: Irina Yanina
12:25 2025-04-02 UTC+2
823
- Today the USD/CAD pair is attempting to halt yesterday's decline, trying to hold above the 1.4300 level.
Autor: Irina Yanina
12:22 2025-04-02 UTC+2
808
- Technical analysis
Trading Signals for GOLD (XAU/USD) for April 2-5, 2025: sell below $3,140 or buy above $3,110 (21 SMA - symmetrical triangle)
The symmetrical triangle pattern observed on the H4 chart shows that gold could experience a strong bullish impulse to reach 3,169, where resistance R_1 is located. Below this area, a technical correction could occur.Autor: Dimitrios Zappas
15:15 2025-04-02 UTC+2
748
- The BTC/USD pair managed to halt its decline, and the current wave structure suggests a potential rise in the world's leading cryptocurrency.
Autor: Chin Zhao
12:17 2025-04-02 UTC+2
688
- Forecast for GBP/USD on April 2, 2025
Autor: Samir Klishi
11:17 2025-04-02 UTC+2
673