Aktuální formace

Formace jsou grafické modely, které jsou v grafu vytvořeny podle ceny. Podle jednoho z technických postulátů se historie (cenový pohyb) opakuje. Znamená to, že pohyby cen jsou často podobné ve stejných situacích, které umožňují předvídat další vývoj situace s vysokou pravděpodobností
Aktuální formace od společnosti InstaSpot jsou snadno použitelnou službou, které vám umožňují seznámit se s nejnovějšími změnami na trhu a reagovat na na správém trhu v reálném čase. V našich službách vždy najdete nejnovější a nejrelevantnější formace na jakémkoli páru a jakémkoli časovém rámci.
Double Bottom
was formed on 28.03 at 15:29:59 (UTC+0)
signal strength 3 of 5
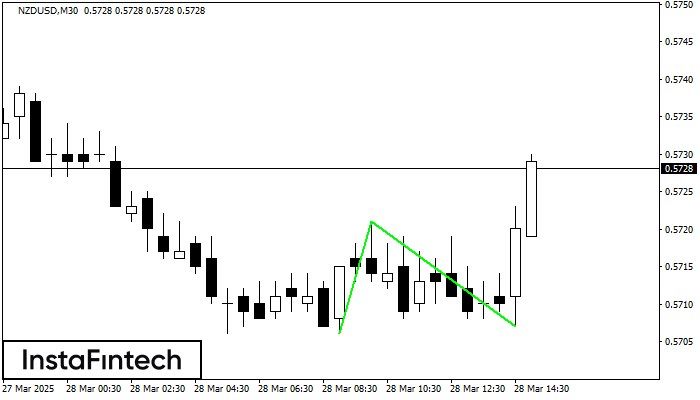
The Double Bottom pattern has been formed on NZDUSD M30. Characteristics: the support level 0.5706; the resistance level 0.5721; the width of the pattern 15 points. If the resistance level is broken, a change in the trend can be predicted with the first target point lying at the distance of 14 points.
- Vše
- Vše
- Bullish Rectangle
- Bullish Symmetrical Triangle
- Bullish Symmetrical Triangle
- Double Bottom
- Double Top
- Double Top
- Triple Top
- Triple Top
- Triple Top
- Triple Top
- Vše
- Buy (nákup)
- Sale (prodej)
- Vše
- Vše
- 1
- 2
- 3
- 4
- 5
Bullisches Rechteck
was formed on 21.04 at 06:10:19 (UTC+0)
signal strength 1 of 5

Auf dem Chart M5 bildete #Bitcoin das «Bullisches Rechteck» Muster. Dies ist das Muster einer Trendfortsetzung. Die untere Grenze des Musters liegt bei 87098.24; die obere bei 87617.56. Bei einem
Die М5 und М15 Timeframes können mehrere falsche Einstiegspunkte haben.
Open chart in a new window
Doppel-Boden
was formed on 21.04 at 06:05:07 (UTC+0)
signal strength 1 of 5

Auf dem Chart M5 bildete USDJPY das «Doppel-Boden» Muster. Diese Formation signalisiert eine Trendwende von unten nach oben. Signal: eine Kaufposition sollte nach dem Durchbruch der oberen Grenze des Musters
Die М5 und М15 Timeframes können mehrere falsche Einstiegspunkte haben.
Open chart in a new window
Doppel-Top
was formed on 21.04 at 05:59:59 (UTC+0)
signal strength 1 of 5
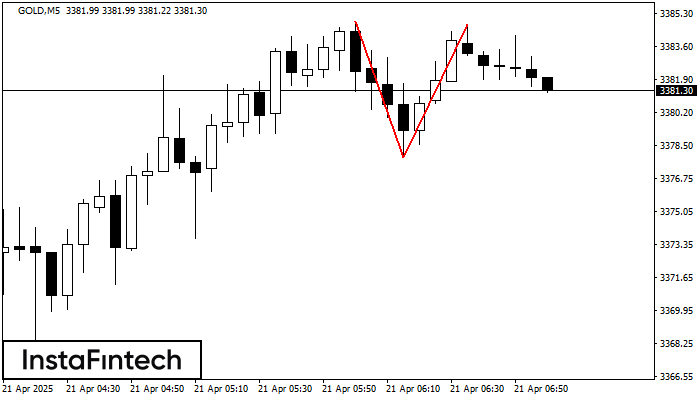
Auf dem Chart M5 bildete GOLD das «Doppel-Top» Muster. Beschreibung: die obere Grenze 3384.89; die untere Grenze3377.85; die Breite des Musters beträgt 687 Punkte. Sell-Position sind besser unter der unteren
Die М5 und М15 Timeframes können mehrere falsche Einstiegspunkte haben.
Open chart in a new window