


Aktuální formace

Formace jsou grafické modely, které jsou v grafu vytvořeny podle ceny. Podle jednoho z technických postulátů se historie (cenový pohyb) opakuje. Znamená to, že pohyby cen jsou často podobné ve stejných situacích, které umožňují předvídat další vývoj situace s vysokou pravděpodobností
Aktuální formace od společnosti InstaSpot jsou snadno použitelnou službou, které vám umožňují seznámit se s nejnovějšími změnami na trhu a reagovat na na správém trhu v reálném čase. V našich službách vždy najdete nejnovější a nejrelevantnější formace na jakémkoli páru a jakémkoli časovém rámci.
Double Top
was formed on 07.04 at 02:30:10 (UTC+0)
signal strength 1 of 5
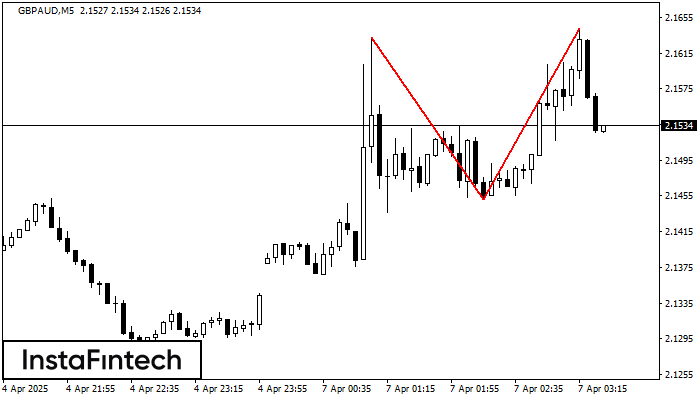
On the chart of GBPAUD M5 the Double Top reversal pattern has been formed. Characteristics: the upper boundary 2.1642; the lower boundary 2.1451; the width of the pattern 191 points. The signal: a break of the lower boundary will cause continuation of the downward trend targeting the 2.1436 level.
The M5 and M15 time frames may have more false entry points.
- Vše
- Vše
- Bullish Rectangle
- Bullish Symmetrical Triangle
- Bullish Symmetrical Triangle
- Double Bottom
- Double Top
- Double Top
- Triple Top
- Triple Top
- Triple Top
- Triple Top
- Vše
- Buy (nákup)
- Sale (prodej)
- Vše
- Vše
- 1
- 2
- 3
- 4
- 5
Triple Top
was formed on 21.04 at 12:40:05 (UTC+0)
signal strength 1 of 5

On the chart of the GOLD M5 trading instrument, the Triple Top pattern that signals a trend change has formed. It is possible that after formation of the third peak
The M5 and M15 time frames may have more false entry points.
Open chart in a new window
Bearish Symmetrical Triangle
was formed on 21.04 at 12:20:58 (UTC+0)
signal strength 1 of 5

According to the chart of M5, GBPCHF formed the Bearish Symmetrical Triangle pattern. Trading recommendations: A breach of the lower border 1.0783 is likely to encourage a continuation
The M5 and M15 time frames may have more false entry points.
Open chart in a new window
Triple Bottom
was formed on 21.04 at 12:15:45 (UTC+0)
signal strength 2 of 5

The Triple Bottom pattern has formed on the chart of USDJPY M15. Features of the pattern: The lower line of the pattern has coordinates 140.99 with the upper limit 140.99/140.92
The M5 and M15 time frames may have more false entry points.
Open chart in a new window

