


Actual patterns

Patterns are graphical models which are formed in the chart by the price. According to one of the technical analysis postulates, history (price movement) repeats itself. It means that the price movements are often similar in the same situations which makes it possible to predict the further development of the situation with a high probability.
Relevant patterns by InstaSpot is an easy-to-use service which allows you to be aware of latest changes in the market and react to clues from the market in time. In our service you will always find the latest and most relevant patterns on any pair and any timeframe.
Bearish Symmetrical Triangle
was formed on 25.03 at 21:36:34 (UTC+0)
signal strength 3 of 5
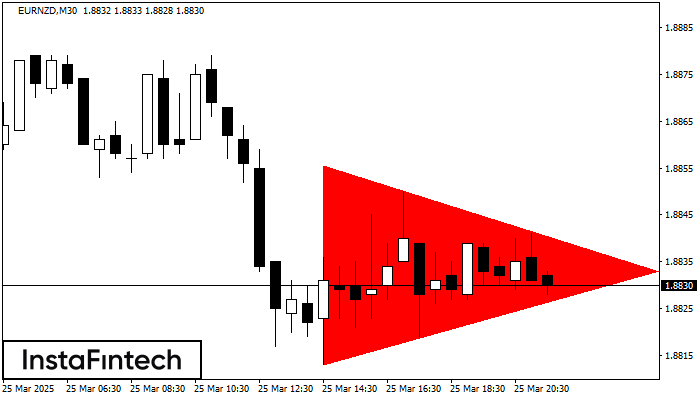
According to the chart of M30, EURNZD formed the Bearish Symmetrical Triangle pattern. This pattern signals a further downward trend in case the lower border 1.8813 is breached. Here, a hypothetical profit will equal the width of the available pattern that is -43 pips.
- All
- All
- Bullish Rectangle
- Bullish Symmetrical Triangle
- Bullish Symmetrical Triangle
- Double Bottom
- Double Top
- Double Top
- Triple Top
- Triple Top
- Triple Top
- Triple Top
- All
- All
- Buy
- Sale
- All
- 1
- 2
- 3
- 4
- 5
Trojitý vrchol
was formed on 16.04 at 20:00:08 (UTC+0)
signal strength 3 of 5

Vzor Trojitý vrchol se vytvořil na grafu M30 u nástroje #MA. Charakteristika vzoru: okraje mají rostoucí úhel; spodní linie vzoru má souřadnice 508.17/512.83 s horní hranicí 523.81/521.51; průmět šířky činí
Open chart in a new window
Dvojité dno
was formed on 16.04 at 19:45:07 (UTC+0)
signal strength 2 of 5
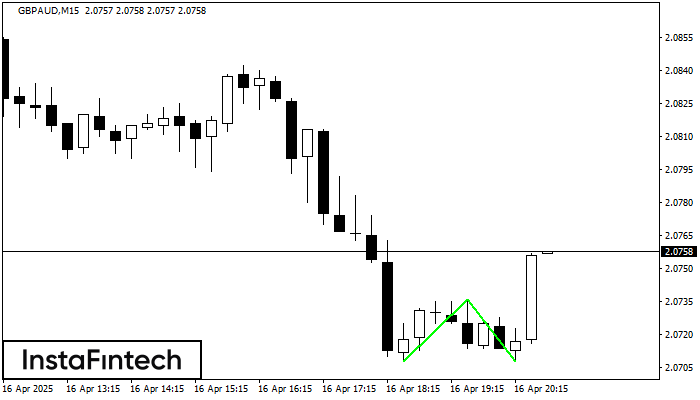
Vzor Dvojité dno se vytvořil na grafu M15 u nástroje GBPAUD; horní hranice je 2.0736; spodní hranice je 2.0708. Šířka vzoru je 28 bodů. V případě průlomu horní hranice 2.0736
Časové rámce M5 a M15 mohou mít více falešných vstupních bodů.
Open chart in a new window
Dvojité dno
was formed on 16.04 at 19:30:25 (UTC+0)
signal strength 1 of 5
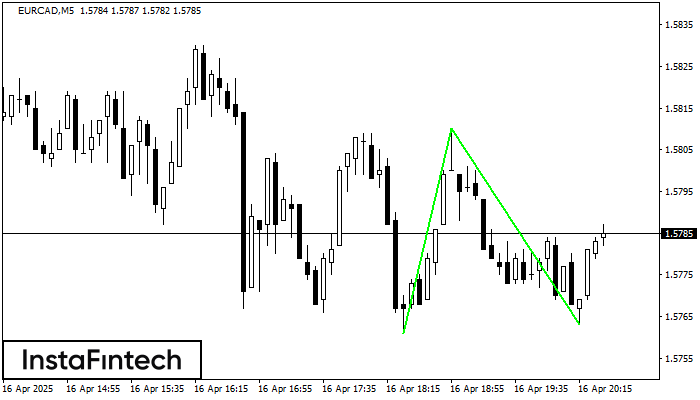
Vzor Dvojité dno se vytvořil na grafu M5 u nástroje EURCAD; horní hranice je 1.5810; spodní hranice je 1.5763. Šířka vzoru je 49 bodů. V případě průlomu horní hranice 1.5810
Časové rámce M5 a M15 mohou mít více falešných vstupních bodů.
Open chart in a new window

