Actual patterns

Patterns are graphical models which are formed in the chart by the price. According to one of the technical analysis postulates, history (price movement) repeats itself. It means that the price movements are often similar in the same situations which makes it possible to predict the further development of the situation with a high probability.
Relevant patterns by InstaSpot is an easy-to-use service which allows you to be aware of latest changes in the market and react to clues from the market in time. In our service you will always find the latest and most relevant patterns on any pair and any timeframe.
Double Top
was formed on 31.03 at 16:00:13 (UTC+0)
signal strength 3 of 5
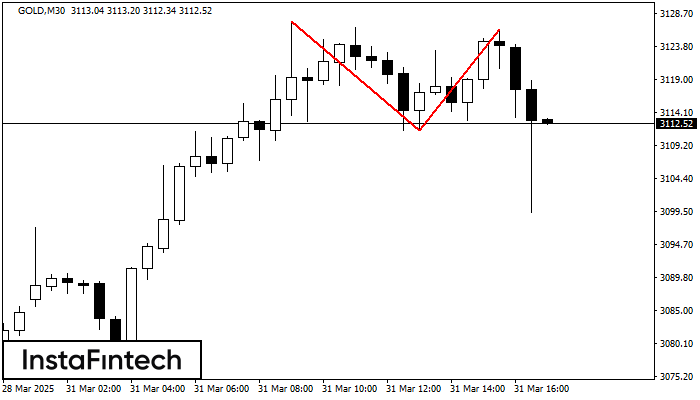
The Double Top reversal pattern has been formed on GOLD M30. Characteristics: the upper boundary 3127.49; the lower boundary 3111.43; the width of the pattern is 1491 points. Sell trades are better to be opened below the lower boundary 3111.43 with a possible movements towards the 3111.13 level.
- All
- All
- Bullish Rectangle
- Bullish Symmetrical Triangle
- Bullish Symmetrical Triangle
- Double Bottom
- Double Top
- Double Top
- Triple Top
- Triple Top
- Triple Top
- Triple Top
- All
- All
- Buy
- Sale
- All
- 1
- 2
- 3
- 4
- 5
Bullisches Rechteck
was formed on 21.04 at 06:10:19 (UTC+0)
signal strength 1 of 5

Auf dem Chart M5 bildete #Bitcoin das «Bullisches Rechteck» Muster. Dies ist das Muster einer Trendfortsetzung. Die untere Grenze des Musters liegt bei 87098.24; die obere bei 87617.56. Bei einem
Die М5 und М15 Timeframes können mehrere falsche Einstiegspunkte haben.
Open chart in a new window
Doppel-Boden
was formed on 21.04 at 06:05:07 (UTC+0)
signal strength 1 of 5

Auf dem Chart M5 bildete USDJPY das «Doppel-Boden» Muster. Diese Formation signalisiert eine Trendwende von unten nach oben. Signal: eine Kaufposition sollte nach dem Durchbruch der oberen Grenze des Musters
Die М5 und М15 Timeframes können mehrere falsche Einstiegspunkte haben.
Open chart in a new window
Doppel-Top
was formed on 21.04 at 05:59:59 (UTC+0)
signal strength 1 of 5
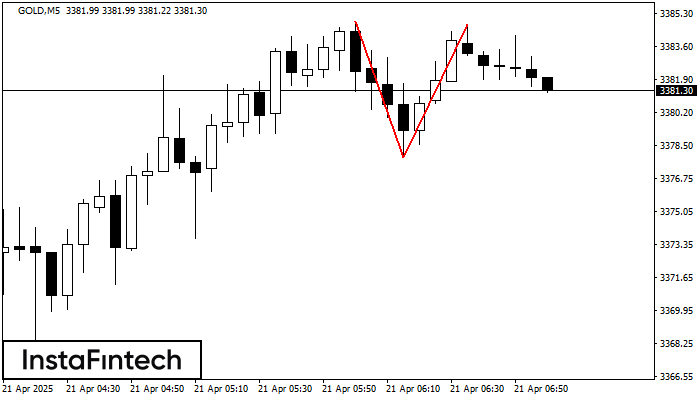
Auf dem Chart M5 bildete GOLD das «Doppel-Top» Muster. Beschreibung: die obere Grenze 3384.89; die untere Grenze3377.85; die Breite des Musters beträgt 687 Punkte. Sell-Position sind besser unter der unteren
Die М5 und М15 Timeframes können mehrere falsche Einstiegspunkte haben.
Open chart in a new window