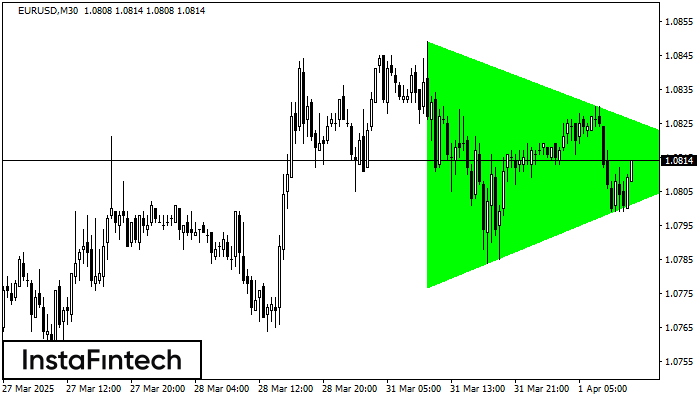
Bullish Symmetrical Triangle
was formed on 01.04 at 10:36:33 (UTC+0)
signal strength 3 of 5

According to the chart of M30, EURUSD formed the Bullish Symmetrical Triangle pattern. Description: This is the pattern of a trend continuation. 1.0849 and 1.0777 are the coordinates of the upper and lower borders respectively. The pattern width is measured on the chart at 72 pips. Outlook: If the upper border 1.0849 is broken, the price is likely to continue its move by 1.0844.
- All
- All
- Bullish Rectangle
- Bullish Symmetrical Triangle
- Bullish Symmetrical Triangle
- Double Bottom
- Double Top
- Double Top
- Triple Top
- Triple Top
- Triple Top
- Triple Top
- All
- All
- Buy
- Sale
- All
- 1
- 2
- 3
- 4
- 5
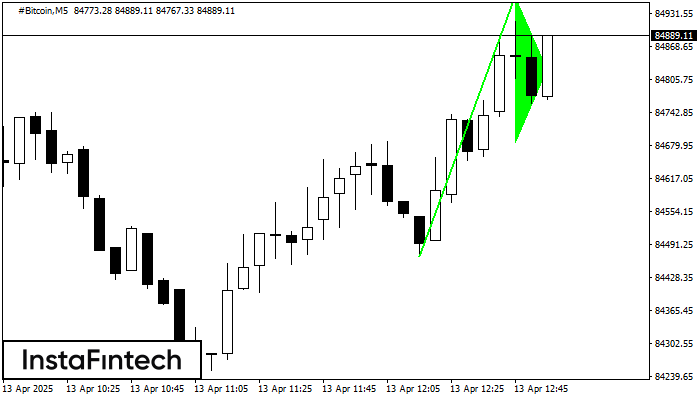
Bullischer Wimpel
was formed on 13.04 at 11:56:52 (UTC+0)
signal strength 1 of 5
Signal«Bullischer Wimpel» – Handelsinstrument #Bitcoin M5, Fortsetzungsmuster. Prognose: eine Kaufposition über dem Musterhoch von 84963.00 eingehen
Die М5 und М15 Timeframes können mehrere falsche Einstiegspunkte haben.
Open chart in a new window
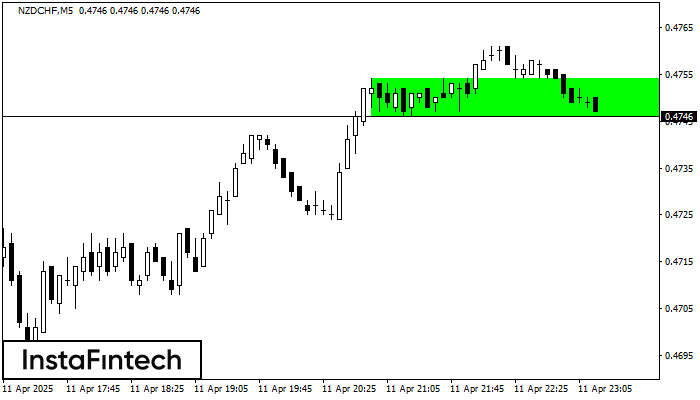
Bullisches Rechteck
was formed on 11.04 at 22:20:31 (UTC+0)
signal strength 1 of 5
Auf dem Chart M5 bildete NZDCHF das «Bullisches Rechteck» Muster. Das Muster deutet auf eine Trendfortsetzung hin. Die obere Grenze ist 0.4754, die untere Grenze ist 0.4746. Das Signal bedeutet
Die М5 und М15 Timeframes können mehrere falsche Einstiegspunkte haben.
Open chart in a new window
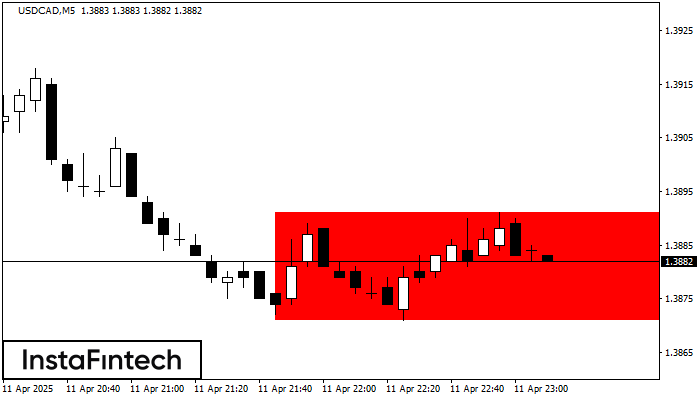
Bärisches Rechteck
was formed on 11.04 at 22:10:27 (UTC+0)
signal strength 1 of 5
Auf dem Chart M5 bildete USDCAD das «Bärisches Rechteck» Muster. Dies ist das Muster einer Trendfortsetzung. Es befindet sich innerhalb der folgenden Grenzen: die obere Grenze liegt bei 1.3871;
Die М5 und М15 Timeframes können mehrere falsche Einstiegspunkte haben.
Open chart in a new window


