


Our team has over 7,000,000 traders!
Every day we work together to improve trading. We get high results and move forward.
Recognition by millions of traders all over the world is the best appreciation of our work! You made your choice and we will do everything it takes to meet your expectations!
We are a great team together!
InstaSpot. Proud to work for you!


Actor, UFC 6 tournament champion and a true hero!
The man who made himself. The man that goes our way.
The secret behind Taktarov's success is constant movement towards the goal.
Reveal all the sides of your talent!
Discover, try, fail - but never stop!
InstaSpot. Your success story starts here!

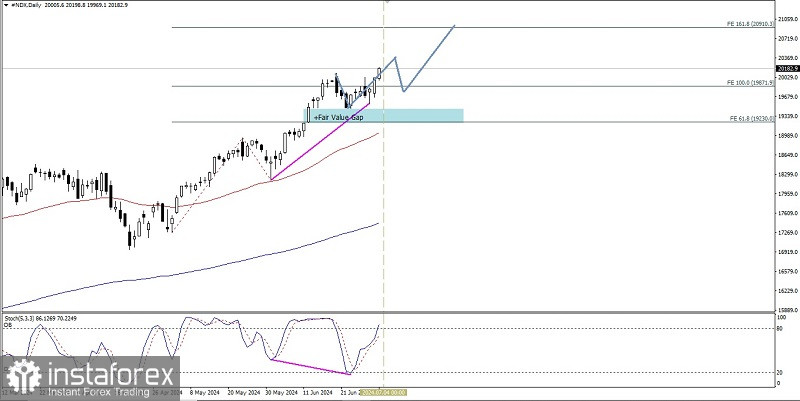
Based on what appears on the daily chart of the Nasdaq 100 index, it appears that buyers are still dominating #NDX, where this can be seen in the condition of the EMA 50 which is above the EMA 200, where the Golden Cross indicates that the Bullish bias in this index is still ongoing, coupled with confirmation of the emergence of irregularities. hidden from the price movement of #NDX which is increasingly forming a Lower High but on the contrary the Stochastic Oscillator indicator is actually forming a Lower Low so based on these facts in the next few days #NDX has the potential to continue its strengthening up to level 20910.3 but if it is on its way to that level suddenly- suddenly there is a quite significant correction, especially if it breaks below the 19220.0 level, it is very likely that the ongoing strengthening in the index will be halted for the next few days.
(Disclaimer)
*The market analysis posted here is meant to increase your awareness, but not to give instructions to make a trade.
InstaSpot analytical reviews will make you fully aware of market trends! Being an InstaSpot client, you are provided with a large number of free services for efficient trading.


