


Our team has over 7,000,000 traders!
Every day we work together to improve trading. We get high results and move forward.
Recognition by millions of traders all over the world is the best appreciation of our work! You made your choice and we will do everything it takes to meet your expectations!
We are a great team together!
InstaSpot. Proud to work for you!


Actor, UFC 6 tournament champion and a true hero!
The man who made himself. The man that goes our way.
The secret behind Taktarov's success is constant movement towards the goal.
Reveal all the sides of your talent!
Discover, try, fail - but never stop!
InstaSpot. Your success story starts here!

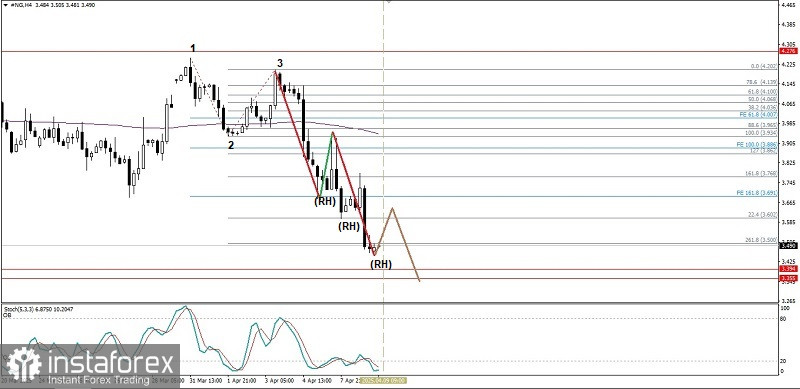
On the 4-hour chart of the Natural Gas commodity instrument, a Bearish 123 pattern appears followed by a Bearish Ross Hook (RH) followed by a Natural Gas price movement below the EMA (200) indicating that Sellers dominate this commodity instrument so that there is a potential for weakening in Natural Gas which will bring #NG to the area level of 3.394-3.355 and if the momentum of the weakening and volatility support it, 3.073 will be the next target, but with the position of the Stochastic Oscillator which is already at the Oversold level, there is also the potential for a strengthening correction, but as long as the strengthening does not break through and close above 3.768, #NG will still be dominated by Sellers.
(Disclaimer)
*The market analysis posted here is meant to increase your awareness, but not to give instructions to make a trade.
InstaSpot analytical reviews will make you fully aware of market trends! Being an InstaSpot client, you are provided with a large number of free services for efficient trading.


