- Fundamental analysis
GBP/USD Overview – April 22: Dollar Decline Neutralizes Any Positive Economic Changes
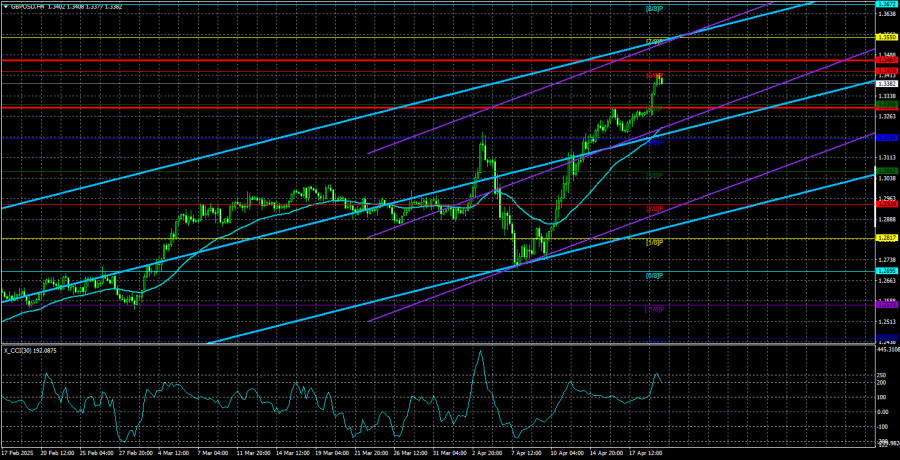
The GBP/USD currency pair also traded higher on Monday despite no clear reasons or fundamental grounds for this movement. However, the pound has risen even on days when the euroAuthor: Paolo Greco
03:12 2025-04-22 UTC+2
4
The EUR/USD currency pair began Monday with a sharp drop from the opening. Interestingly, this time, the fall of the US dollar wasn't triggered by the American president. Any specificAuthor: Paolo Greco
03:12 2025-04-22 UTC+2
5
Trading planTrading Recommendations and Analysis for GBP/USD on April 22: Nothing Has Changed for the Pound
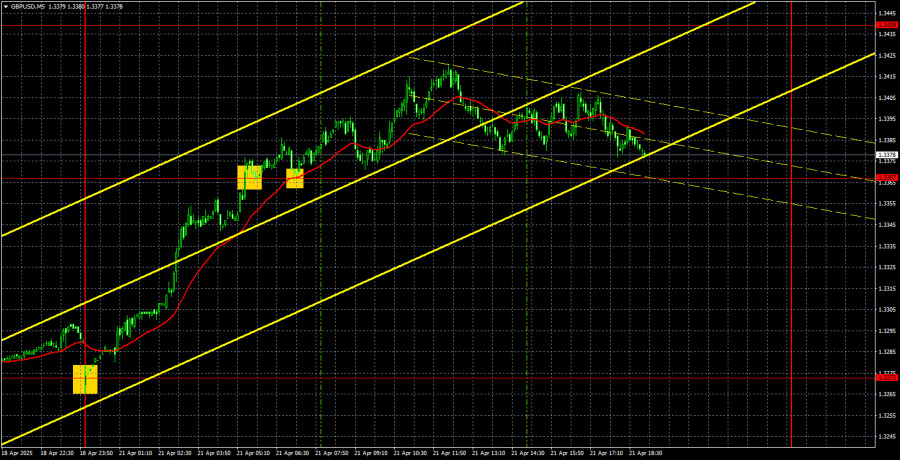
The GBP/USD currency pair continued its upward movement on Monday as it did last week. The only difference was the strength of the movement. On Monday, volatility was very high—withoutAuthor: Paolo Greco
03:12 2025-04-22 UTC+2
8
- Trading plan
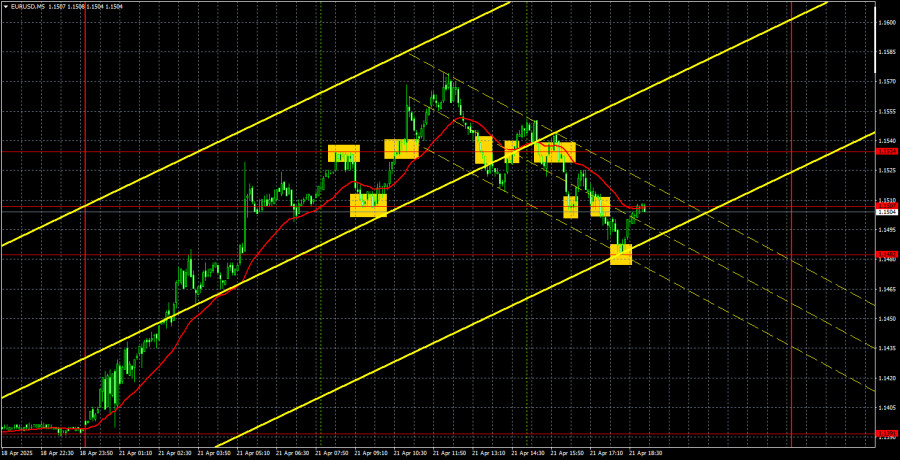
Trading Recommendations and Analysis for EUR/USD on April 22: A New Storm in the Market
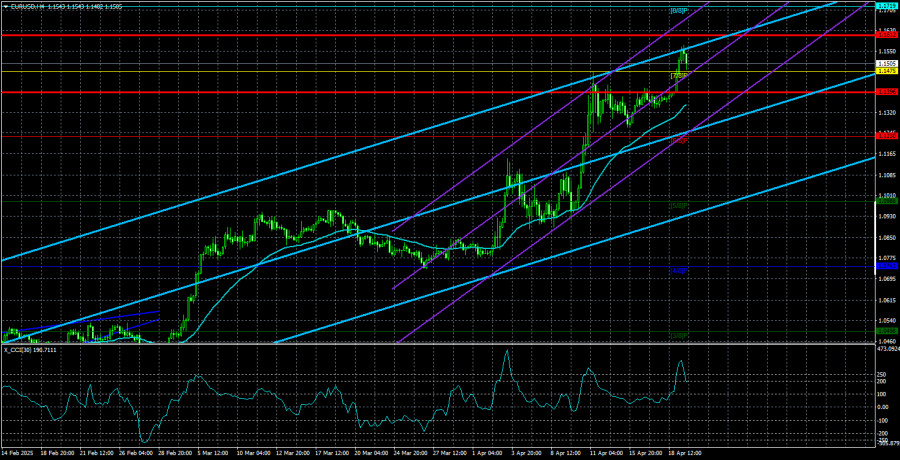
The EUR/USD currency pair shot up again on Monday—straight to the moon. This time, the euro gained a "modest" 150 pips in a single day, even though no macroeconomic reportsAuthor: Paolo Greco
03:12 2025-04-22 UTC+2
9
The U.S. Dollar Index updated a three-year low on Monday, falling into the 97 range (for the first time since March 2022). The greenback started the trading week withAuthor: Irina Manzenko
01:07 2025-04-22 UTC+2
8
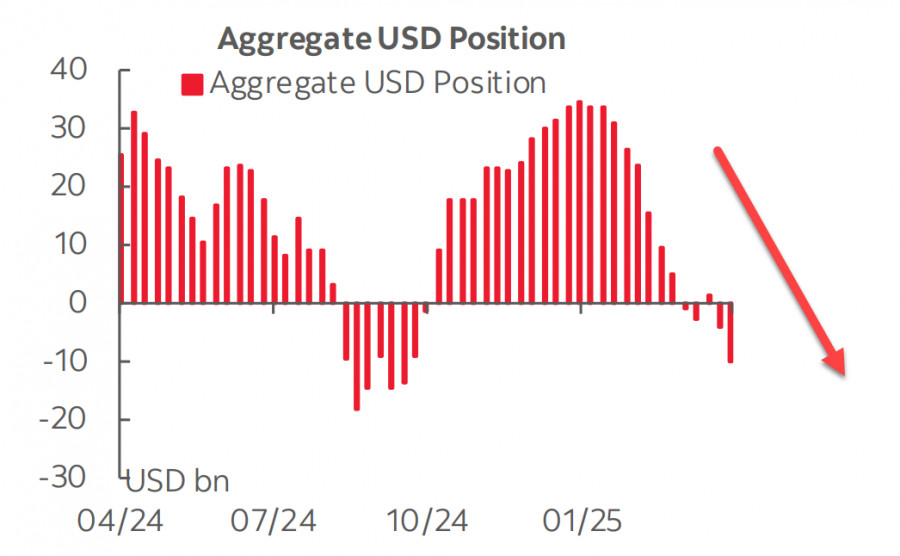
Fundamental analysisPanic hasn't gone anywhere – the dollar is being sold off, gold is rising, and the S&P 500 has turned downward again
The total speculative bearish position on the US dollar more than doubled over the reporting week, reaching -$10.1 billion. The Canadian dollar and the yen strengthened the most, whileAuthor: Kuvat Raharjo
01:07 2025-04-22 UTC+2
10
- Be careful what you wish for. Donald Trump's desire to make America great again and return to a golden age is backfiring by eroding trust in U.S. assets, capital flight
Author: Marek Petkovich
01:07 2025-04-22 UTC+2
11
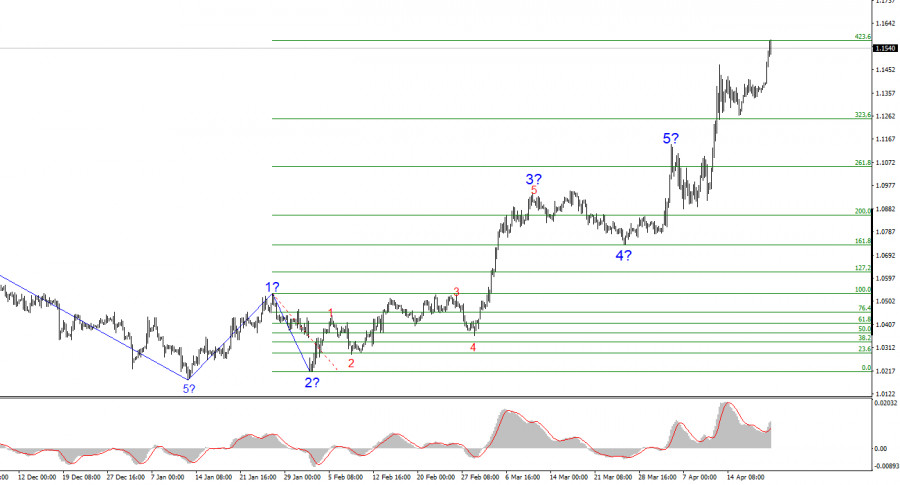
The wave structure on the 4-hour chart for EUR/USD has transformed into a bullish formation. I believe there's little doubt that this transformation occurred solely due to the new U.SAuthor: Chin Zhao
19:46 2025-04-21 UTC+2
30
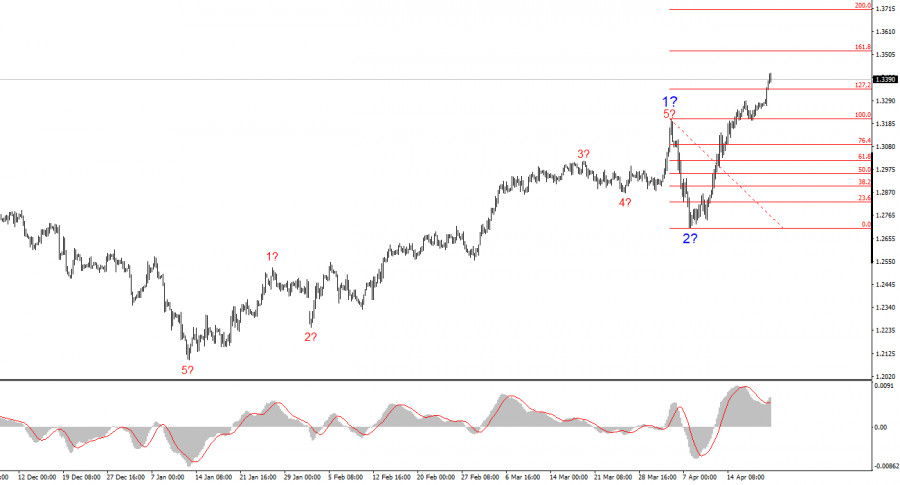
The wave structure for GBP/USD has also transformed into a bullish, impulsive formation—"thanks" to Donald Trump. The wave picture is nearly identical to that of EUR/USD. Up until FebruaryAuthor: Chin Zhao
19:44 2025-04-21 UTC+2
27


