

Our team has over 7,000,000 traders!
Every day we work together to improve trading. We get high results and move forward.
Recognition by millions of traders all over the world is the best appreciation of our work! You made your choice and we will do everything it takes to meet your expectations!
We are a great team together!
InstaSpot. Proud to work for you!


Actor, UFC 6 tournament champion and a true hero!
The man who made himself. The man that goes our way.
The secret behind Taktarov's success is constant movement towards the goal.
Reveal all the sides of your talent!
Discover, try, fail - but never stop!
InstaSpot. Your success story starts here!


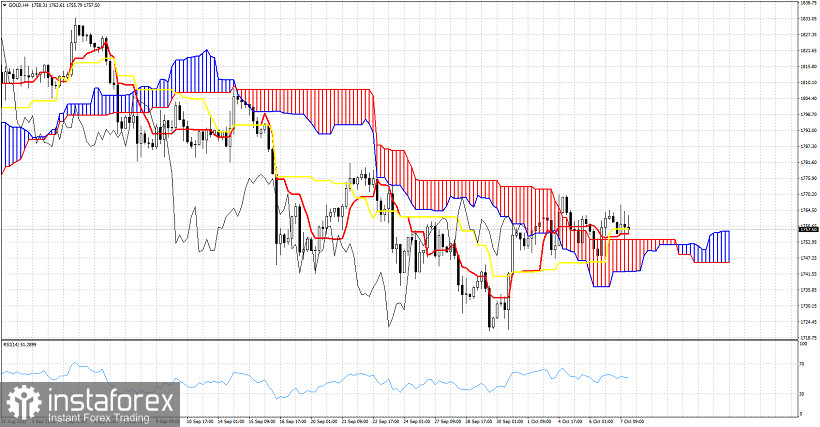
Gold price is at $1,756. The Ichimoku cloud indicator provides a contradicting result between the 4 hour chart and the Daily chart. This reflects the indecision and the lack of a clear direction in the specific market.
In the 4 hour chart Gold price is trading above the Kumo (cloud) and above both the tenkan-sen (Red line indicator) and the kijun-sen (yellow line indicator). However the tenkan-sen is below the kijun-sen. This is not a clear bullish confirmation, but staying above the cloud in the 4 hour chart is key for bulls to be able to change short-term trend to bullish. If the tenkan-sen crosses above the kijun-sen and price is above the Kumo, then we get a strong bullish signal.In the Daily chart we see Gold price trying to crawl inside the Kumo in order to change trend to neutral. Price is below the kijun-sen but above the tenkan-sen. The tenkan-sen provides support at $1,745. Breaking below this level will provide a bearish signal. Bulls need to push price above the cloud and the kijun-sen resistance at $1,778. If this happens then we will get an important bullish signal.*The market analysis posted here is meant to increase your awareness, but not to give instructions to make a trade.
InstaSpot analytical reviews will make you fully aware of market trends! Being an InstaSpot client, you are provided with a large number of free services for efficient trading.
InstaSpot video
analytics
Daily analytical reviews
InstaSpot
video analytics

Your IP address shows that you are currently located in the USA. If you are a resident of the United States, you are prohibited from using the services of InstaFintech Group including online trading, online transfers, deposit/withdrawal of funds, etc.
If you think you are seeing this message by mistake and your location is not the US, kindly proceed to the website. Otherwise, you must leave the website in order to comply with government restrictions.
Why does your IP address show your location as the USA?
Please confirm whether you are a US resident or not by clicking the relevant button below. If you choose the wrong option, being a US resident, you will not be able to open an account with InstaSpot anyway.
We are sorry for any inconvenience caused by this message.

