


Our team has over 7,000,000 traders!
Every day we work together to improve trading. We get high results and move forward.
Recognition by millions of traders all over the world is the best appreciation of our work! You made your choice and we will do everything it takes to meet your expectations!
We are a great team together!
InstaSpot. Proud to work for you!


Actor, UFC 6 tournament champion and a true hero!
The man who made himself. The man that goes our way.
The secret behind Taktarov's success is constant movement towards the goal.
Reveal all the sides of your talent!
Discover, try, fail - but never stop!
InstaSpot. Your success story starts here!

In previous posts we warned Gold bears that price had all the technical justifications for a reversal and we also added the bullish signal by the Ichimoku cloud indicator. Gold price is now trading around $1,810 having retraced nearly 50% of the decline from $1,876.
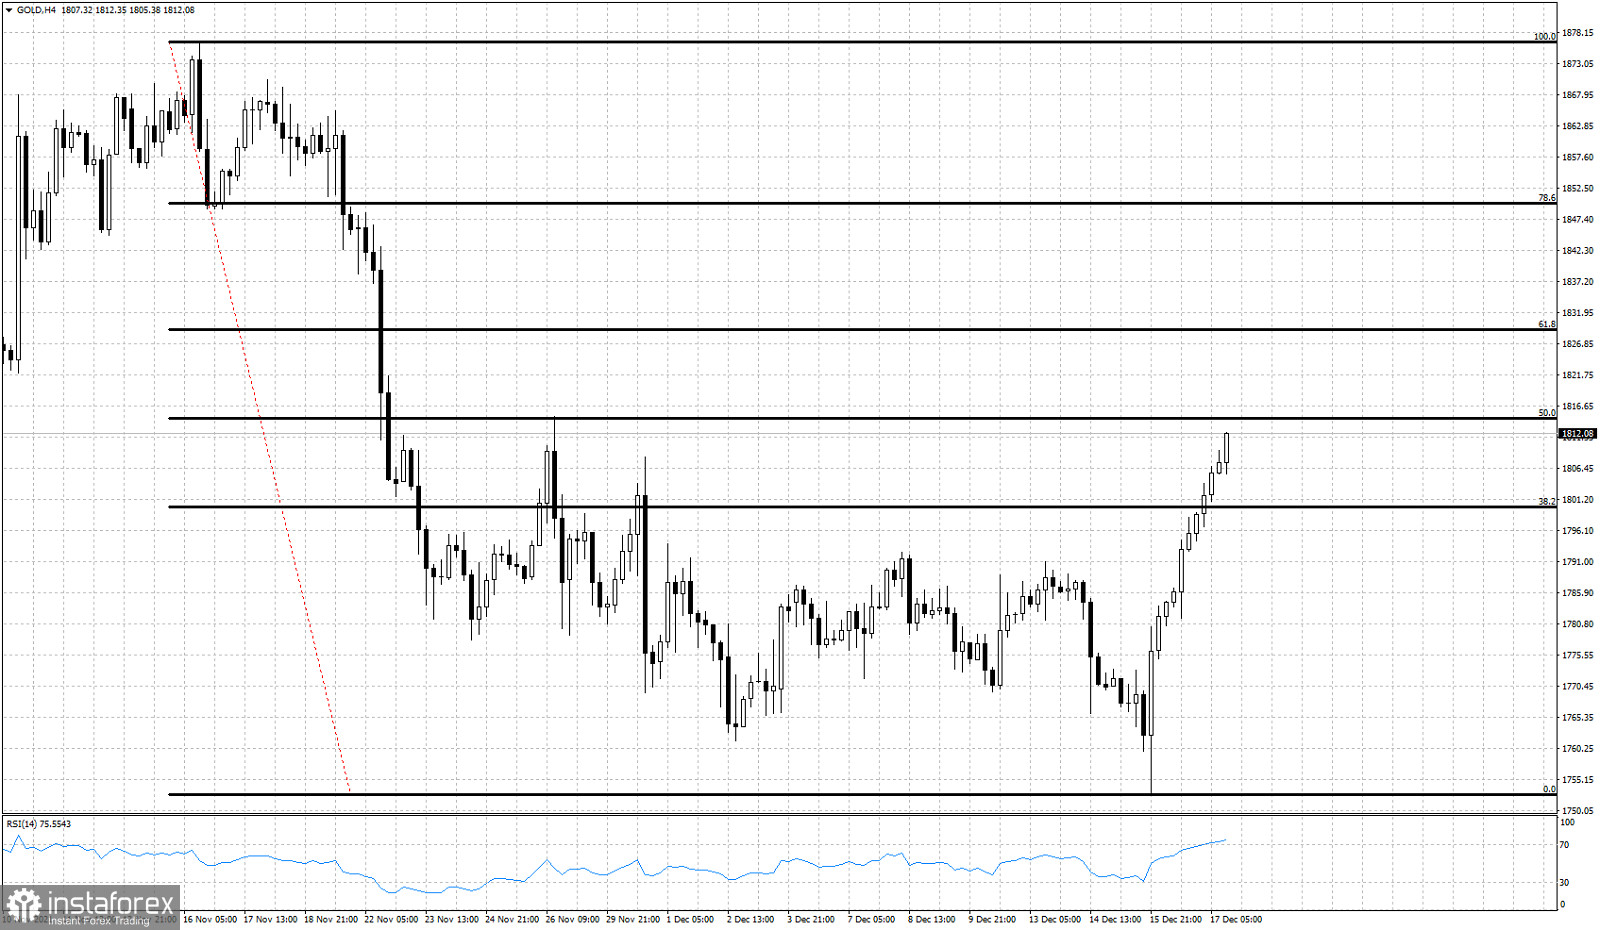
Gold price easily broke above the 38% Fibonacci retracement. Short-term trend is bullish as price is making a sharp move higher with no looking back. Next important resistance level is at the 61.8% retracement level at $1,829. Since Gold price has not made any pull back since the $1,752 low from December 15th, I would not be surprised to see Gold pull back and test the 38% retracement from above.
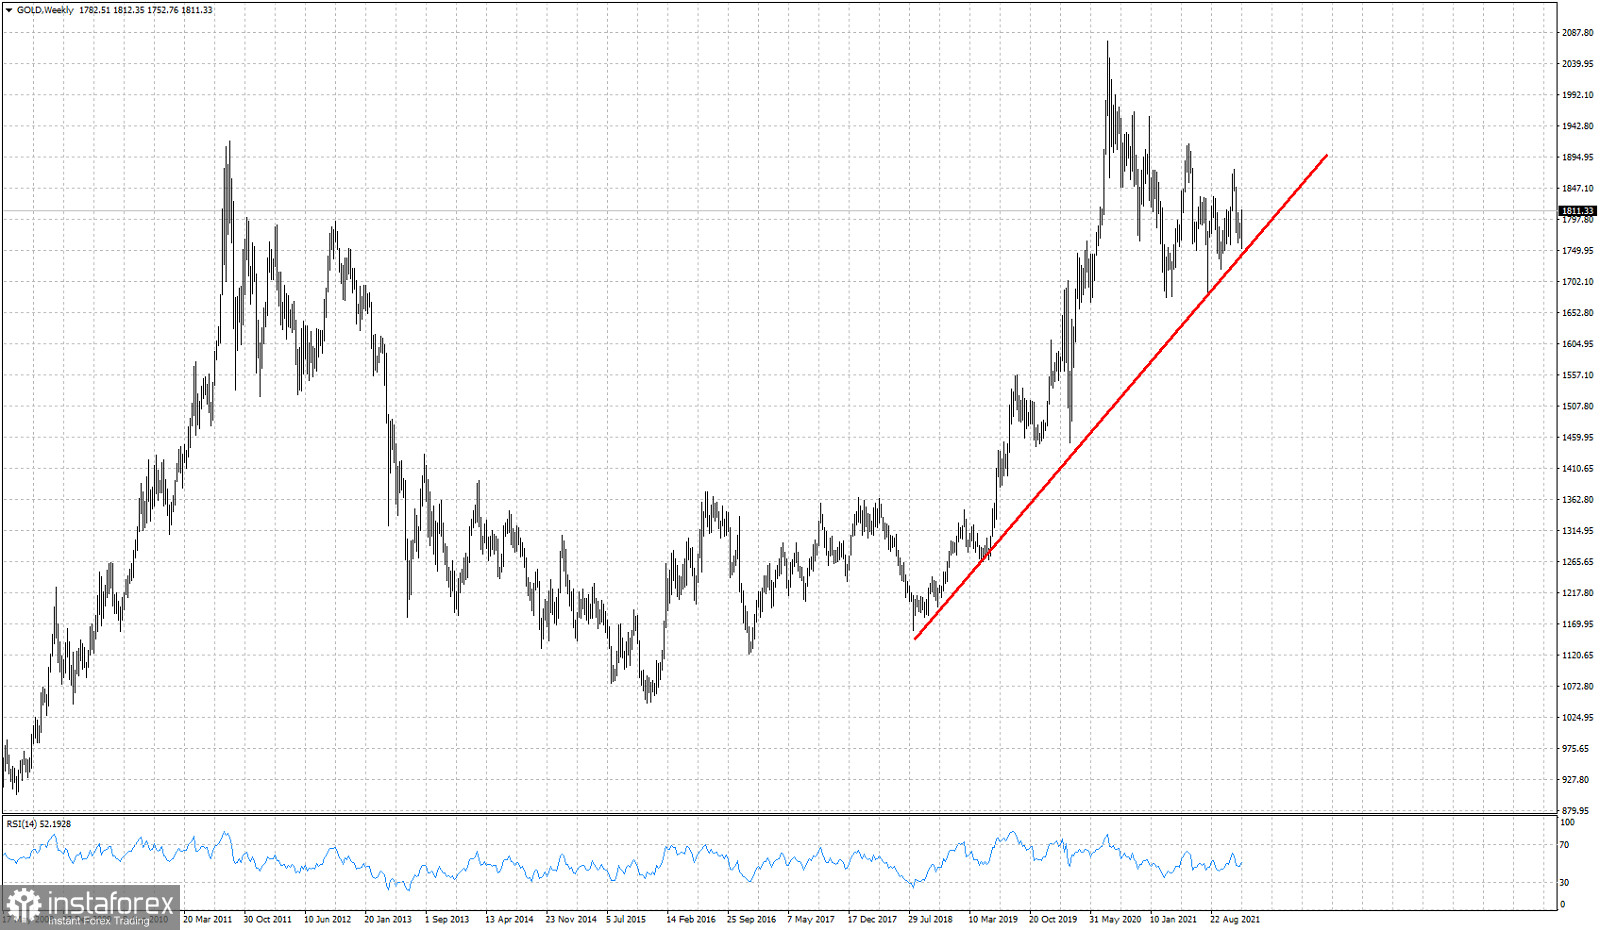
On a weekly basis Gold price continues to respect the red upward sloping trend line. Price nearly touched the trend line this week. Bouncing off the trend line is a bullish sign. This increases the importance of the recent low at $1,750 area. Any break below this level will be an important bearish signal that could lead price towards $1,400-$1,500.
*The market analysis posted here is meant to increase your awareness, but not to give instructions to make a trade.
InstaSpot analytical reviews will make you fully aware of market trends! Being an InstaSpot client, you are provided with a large number of free services for efficient trading.


