Hi dear colleagues!
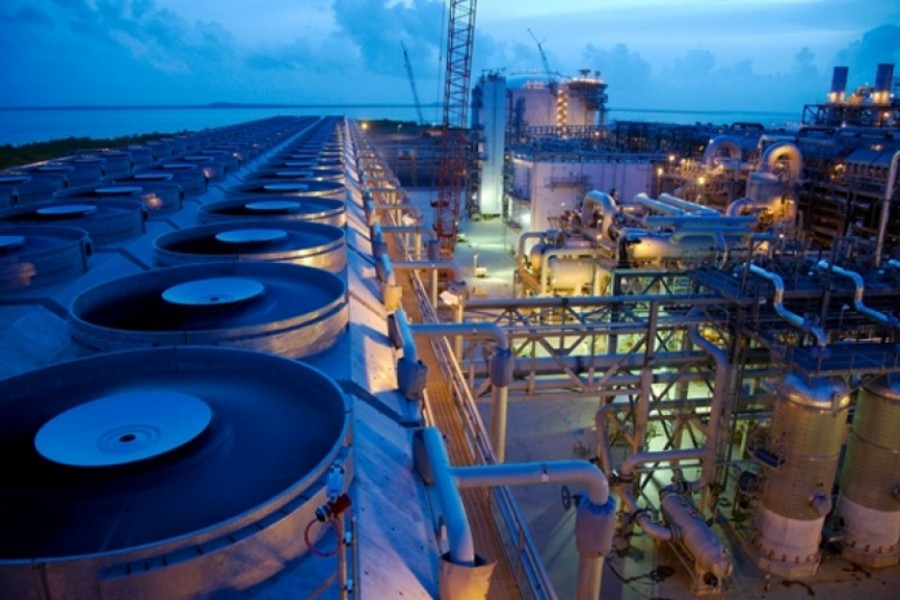
In this article, I'd like to discuss the prospects of the oil market. Investors and traders have been mulling over this burning issue for almost two weeks.
The oil market completed the first half of the year at a record high of $76 a barrel for Brent benchmark. However, Brent crude was declining at a brisk pace in July and August. Brent price sank at the largest degree last week, having lost nearly 10%. The price plummeted from $67 to $61.50. Nevertheless, earlier this week, Brent crude rebounded in confidence that assured traders of a further rally.
At the same time, we are interested in the oil price dynamic not only in terms of earnings on price fluctuations. Trends in the oil market make an impact on some macroeconomic factors ranging from inflation to investment activity as well as from currency rates to food prices.
Now let's try to figure out why I believe that crude oil is not a good asset to buy in the short term until the winter of 2021/22.
The first reason is seasonal. Commonly, oil comes under pressure in the second half of a year because the astronomical summer comes to an end in the Northern hemisphere. Besides, the holiday season is also over in the US and Europe.
The US remains the top oil consumer on the globe. After high season, oil processing plants are shut for maintenance, usually in October – November. Crude oil that is drilled during maintenance has to be kept in storage facilities. Hence, oil drilling companies step up their storage costs while oil prices go down.
Picture 1. Seasonal chart of WTI dynamic for 10 years
The season of tropical storms and hurricanes traditionally begins in the second half of August, lasting for about a month. This factor also causes shutdowns in oil processing plants on the northern shore of the Mexican Gulf where two thirds of US oil processing facilities are clustered. The plants are forced to suspend their operation. In turn, shale oil producers are puzzled about sales that is another headwind for oil prices.
The chart of seasonal price fluctuations of WTI for the last 10 years (picture 1) clearly displays that WTI prices drift lower after the start of the high season. Notably, the decline turns steeper in September and October. Once the price reaches its bottom, it resumes its uptrend in December – January and trades higher until May – June.
The second reason is related to COVID. A few waves of COVID-19 pandemic hurt the global economy throughout 2020. How it seems that the worst is over and advanced global economies have coped with mass vaccination. However, the new Delta variant has undermined all efforts aimed at reviving the global economy and, in turn, global oil consumption.
Picture 2. Commercial air companies are the first to take the brunt of the third COVID wave
Commercial air companies have been the most vulnerable during the third pandemic wave. Air companies, which have not recovered in full in the wake of the pandemic-driven crisis of 2020, have to lick wounds again (picture 2). Instead of the rise in air companies' stocks, that was anticipated in the first half of 2021, such stocks plummeted 20% in July – August.
The third pandemic wave played havoc with Asia-Pacific economies. It dealt a blow to the US, China, India, and Japan. On the whole, all top 10 economies have been hurt to a different extent, though the downturn was not as severe as during the first and second waves.
OPEC+ countries are committed to the implementation of the pact on oil production cuts and even cut their oil output more than prescribed. In July, major oil exporters contracted oil production 109%, more than their quotas. There is the likelihood that OPEC+ will again cut oil output to fine-tune the balance of supply and demand. That will support oil prices at the levels to satisfy participants of the OPEC+ pact.
The third reason is the US dollar's forex rate. Any produce or commodity is denominated in US dollars. Its value forex rate is mainly determined by agreement among central banks which encountered high inflation a few months ago. One of the reasons behind higher inflation across the world is rising oil prices.
We assume that the US dollar's forex rate against other major currency will be on agenda at the summit in Jackson Hole. This week, leaders of global central banks are due to assemble at the symposium. Pushing the US dollar's forex rate up would be a solution to lower commodity prices. In turn, this will contain inflation and allow central banks to carry on with their ultra-loose monetary policy.
Picture 3. The US dollar's forex rate against a basket of 6 major currencies: the euro, Japanese yen, pound sterling, Canadian dollar, Swiss franc, and Swedish krona.
The chart clearly shows that the US dollar forex rate has formed the double bottom. Currently, it is ready to add another 3% to its value, climbing to 95.
The fourth reason is exchange prices. It is common knowledge that oil prices depend not only on the US dollar's strength but also on American exchange floors such as CME-NYMEX and ICE. The lion's share of buyers is speculators who buy oil with a view to earning on its bullish trend. When such speculators see the bullish prospects, they buy futures contracts. When they sniff out a further decline in prices, they sell oil contracts.
Without going into details of the COT report (Commitments of Traders), speculators are scaling down their long positions for a few weeks in a row. This is happening against the backdrop of waning global demand for energy. Open Interest among all participants has been also decreasing since July (Picture 4).
Picture 4. Traders' positions on WTI at CME-NYMEX
When buyers do not want to buy oil and global demand goes down, oil prices might surge in emergency cases. This is what happened at the beginning of the week when a fire struck an offshore oil platform in Mexico and the vaccine by Pfizer was eventually approved in the US.
The fifth reason is technical charts. Technical analysts believe that all information is available in technical charts. Such confidence is certainly justified. Looking at the technical chart for crude oil, I'm losing my enthusiasm to buy this commodity (Picture 5).
Picture 5. Technical chart of WTI
It is known to everyone that an impulse following a technical correction is always stronger than a correction itself. A correction is commonly shorter than an impulse. It is evident that oil prices reversed a trend in August. So, the trend reversed from bullish to bearish. The double top that was formed in July – August is signaling the beginning of the trend reversal. Oil prices are now trading below 50-day moving average, i.e. below their quarterly value. On top of that, MACD indicator sank to the negative territory. All these technical factors prove the beginning of the bearish cycle in the oil market.
To sum up, we have expanded on five weighty reasons which assure us not to buy oil. Notably, speaking about a possible price trajectory, we are discussing feasible scenarios. Even the slightest probability tends to come into practice.
Trade cautiously and always follow the rules of risk management!


