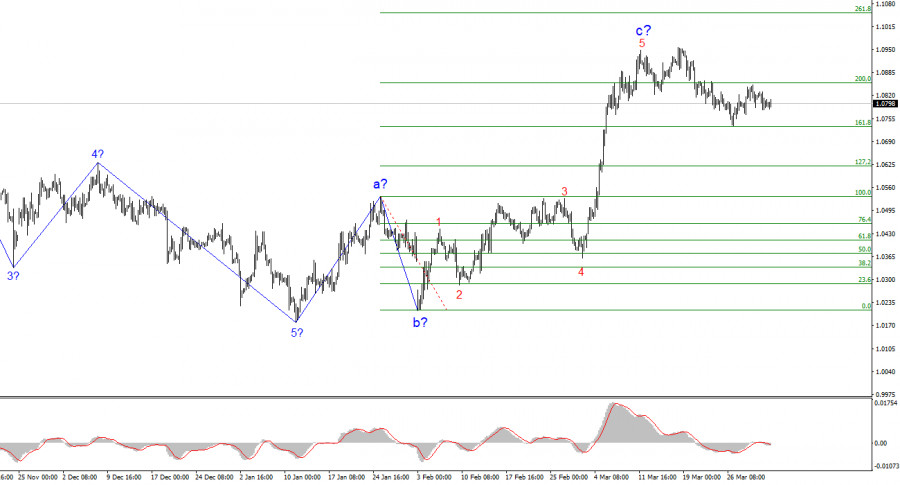
- The wave pattern on the 4-hour EUR/USD chart is on the verge of transforming into a more complex structure. Since September 25 of last year, a new downward wave structure
Author: Chin Zhao
20:25 2025-04-02 UTC+2
18
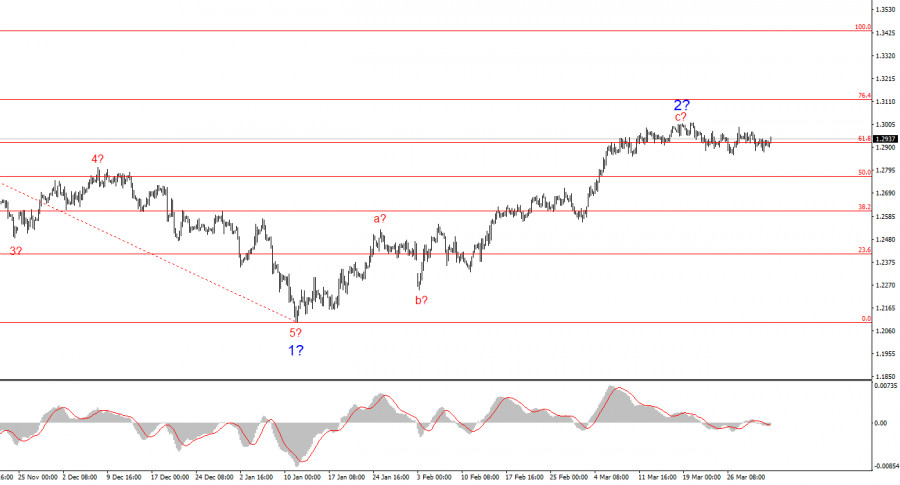
The wave pattern for GBP/USD remains somewhat ambiguous, though generally manageable. Currently, there's still a strong likelihood of a long-term downward trend forming. Wave 5 has taken a convincing shapeAuthor: Chin Zhao
20:23 2025-04-02 UTC+2
12
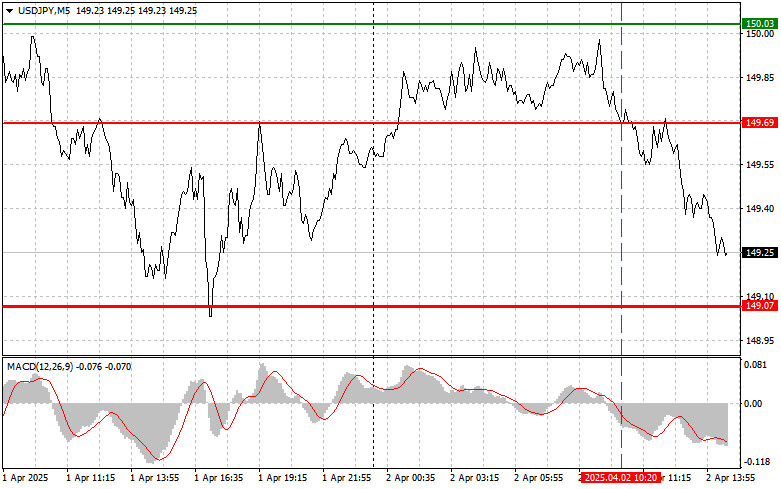
Trade Breakdown and Tips for Trading the Japanese Yen The price test at 149.69 occurred when the MACD indicator had already moved significantly below the zero line, which limitedAuthor: Jakub Novak
20:14 2025-04-02 UTC+2
17
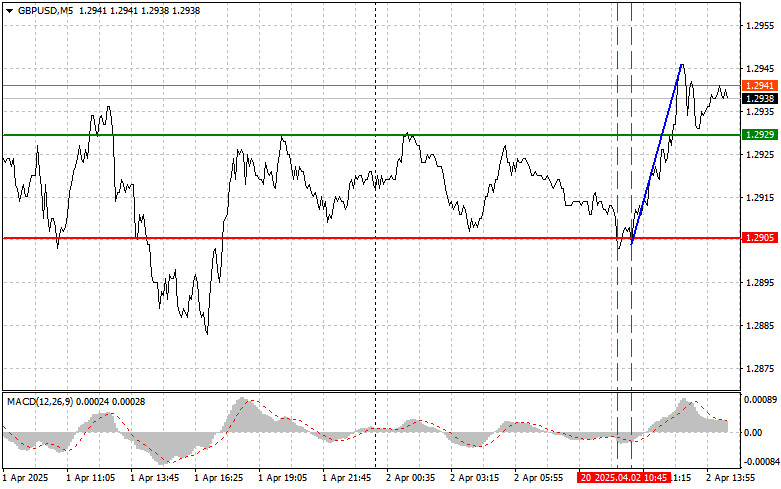
- Trade Breakdown and Tips for Trading the British Pound The price test at 1.2905 occurred when the MACD indicator had already moved significantly below the zero line, which limited
Author: Jakub Novak
20:12 2025-04-02 UTC+2
11
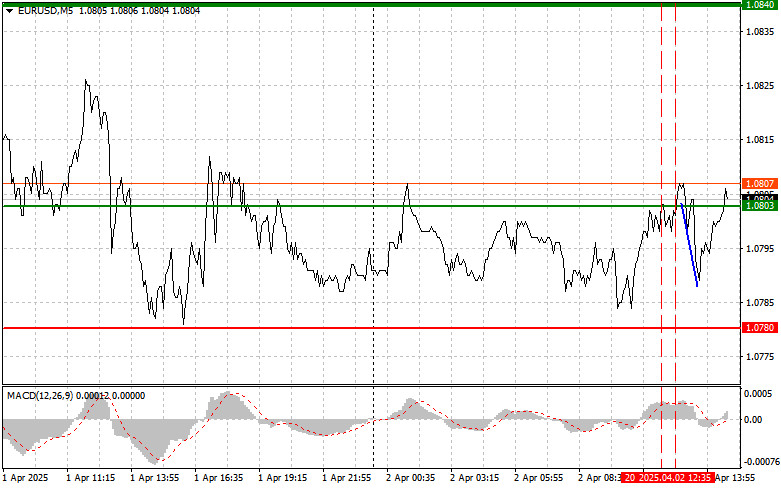
Trade Breakdown and Tips for Trading the Euro The price test at 1.0803 occurred when the MACD indicator had already moved significantly above the zero line, which limited the pair'sAuthor: Jakub Novak
20:09 2025-04-02 UTC+2
14
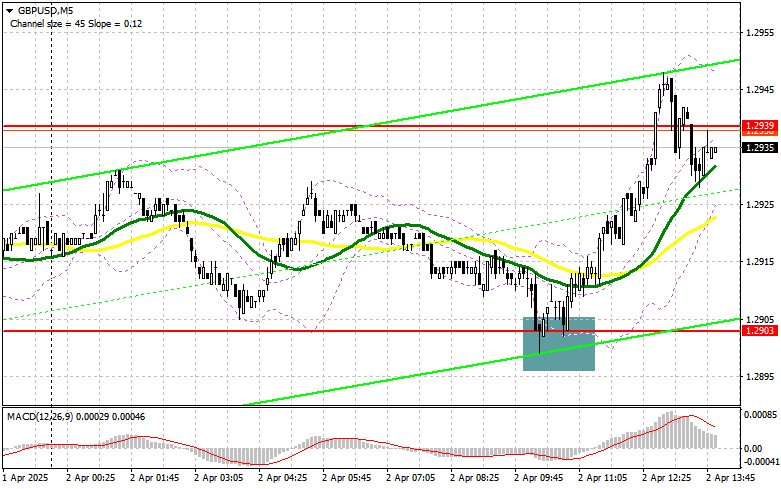
In my morning forecast, I highlighted the 1.2903 level and planned to make trading decisions based on it. Let's look at the 5-minute chart and analyze what happened. A declineAuthor: Miroslaw Bawulski
20:07 2025-04-02 UTC+2
12
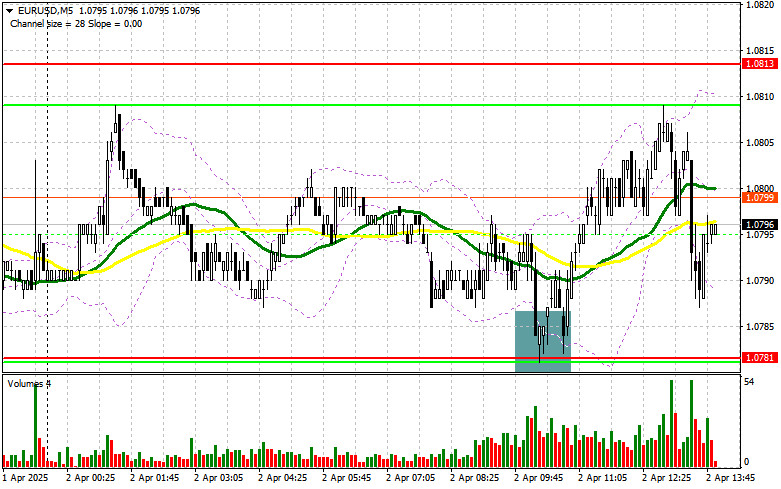
- In my morning forecast, I highlighted the 1.0781 level and planned to make trading decisions based on it. Let's look at the 5-minute chart and break down what happened
Author: Miroslaw Bawulski
20:04 2025-04-02 UTC+2
10
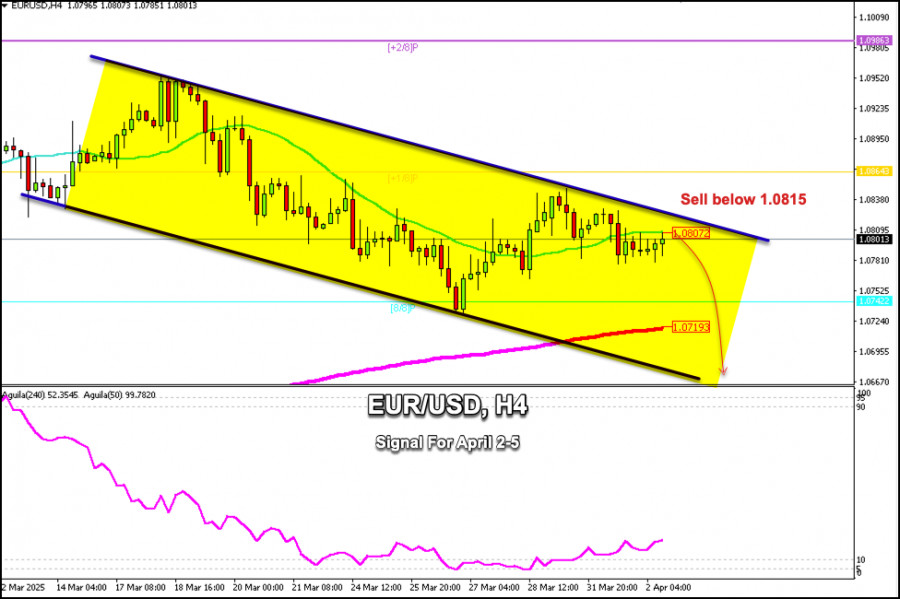
Technical analysisTrading Signals for EUR/USD for April 2-5, 2025: sell below 1.0815 (21 SMA - +1/8 Murray)
If the euro breaks and consolidates above the bearish trend channel, we could expect it to reach +1/8 Murray level at 1.0864 in the coming days. EUR/USD could even reachAuthor: Dimitrios Zappas
15:18 2025-04-02 UTC+2
19
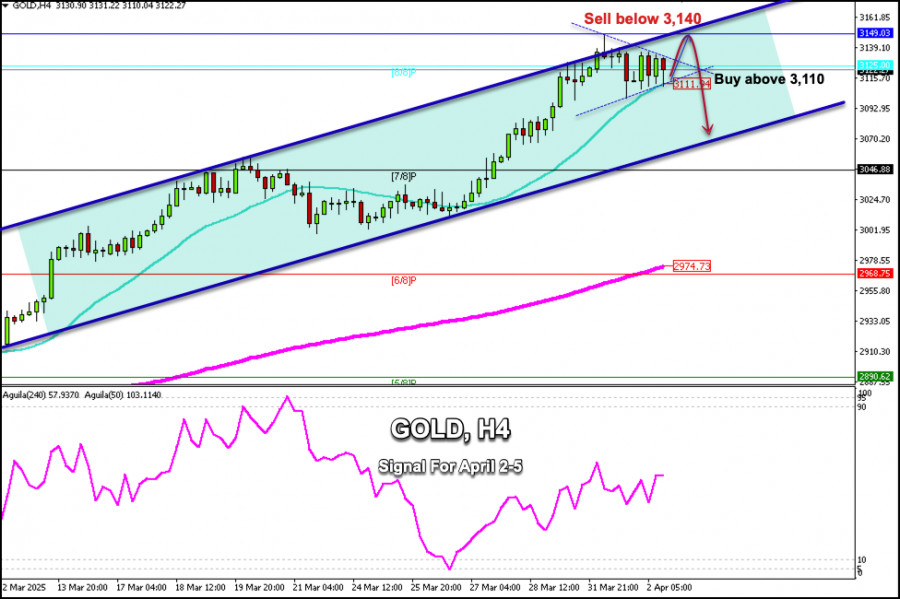
Technical analysisTrading Signals for GOLD (XAU/USD) for April 2-5, 2025: sell below $3,140 or buy above $3,110 (21 SMA - symmetrical triangle)
The symmetrical triangle pattern observed on the H4 chart shows that gold could experience a strong bullish impulse to reach 3,169, where resistance R_1 is located. Below this areaAuthor: Dimitrios Zappas
15:15 2025-04-02 UTC+2
31


