


Our team has over 7,000,000 traders!
Every day we work together to improve trading. We get high results and move forward.
Recognition by millions of traders all over the world is the best appreciation of our work! You made your choice and we will do everything it takes to meet your expectations!
We are a great team together!
InstaSpot. Proud to work for you!


Actor, UFC 6 tournament champion and a true hero!
The man who made himself. The man that goes our way.
The secret behind Taktarov's success is constant movement towards the goal.
Reveal all the sides of your talent!
Discover, try, fail - but never stop!
InstaSpot. Your success story starts here!

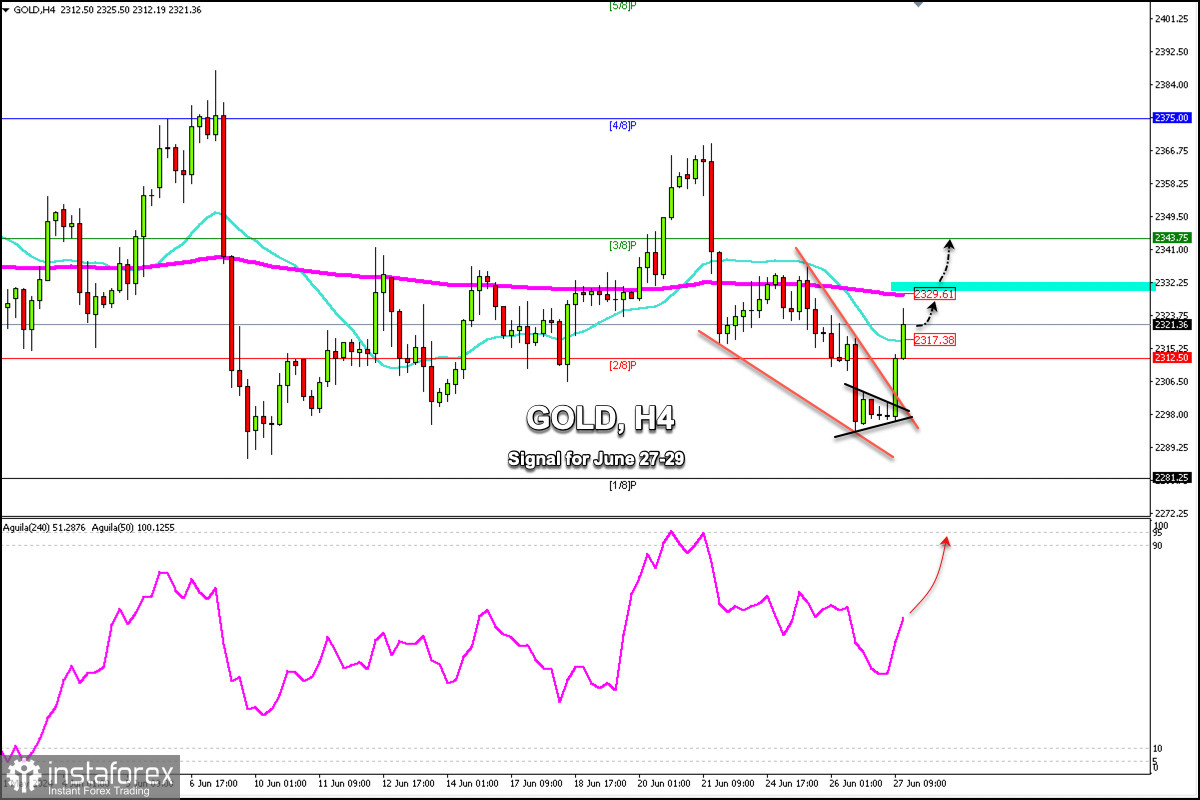
Early in the American session, Gold is trading around 2,321, below the 200 EMA, and above 2/8 Murray. Gold could continue its rise in the coming hours and reach the strong resistance of 2,329. If gold fails to break the resistance of 200 EMA, it could be seen as an opportunity to sell.
According to the H4 chart, gold had formed a symmetrical triangle pattern since June 20. The metal has been trading within this pattern for the last few days.
Additionally, another symmetrical triangle pattern was formed yesterday after the fall towards 2,289. Both were broken which means that gold could continue its rise in the coming days.
In case gold finds strong resistance around 2,330, we could expect there to be a technical correction towards the 21 SMA or even towards 2/8 Murray located at 2,312.
On the other hand, in case gold continues to rise, a consolidation above 2,330 is expected to occur. Then, the outlook could be bullish. Therefore, gold could reach 2,343 and even climb to 4/8 Murray at 2,375.
*The market analysis posted here is meant to increase your awareness, but not to give instructions to make a trade.
InstaSpot analytical reviews will make you fully aware of market trends! Being an InstaSpot client, you are provided with a large number of free services for efficient trading.


