


Our team has over 7,000,000 traders!
Every day we work together to improve trading. We get high results and move forward.
Recognition by millions of traders all over the world is the best appreciation of our work! You made your choice and we will do everything it takes to meet your expectations!
We are a great team together!
InstaSpot. Proud to work for you!


Actor, UFC 6 tournament champion and a true hero!
The man who made himself. The man that goes our way.
The secret behind Taktarov's success is constant movement towards the goal.
Reveal all the sides of your talent!
Discover, try, fail - but never stop!
InstaSpot. Your success story starts here!

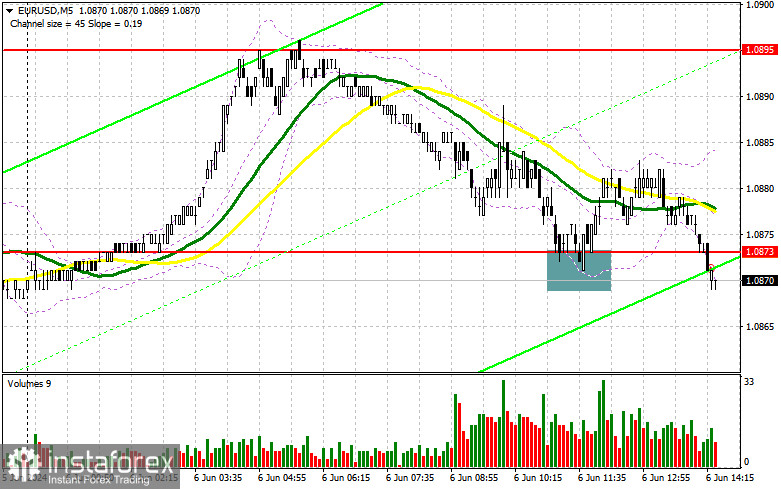
In my morning forecast, I focused on the 1.0873 level and planned to make trading decisions from there. Let's look at the 5-minute chart to understand what happened. A decline and the formation of a false breakout there provided an excellent buy signal for the euro, but after a 10-point upward move, trading returned to the 1.0873 area. As a result, I decided to exit the market and wait for the release of important data. The technical picture for the second half of the day remains unchanged.
For opening long positions on EUR/USD:
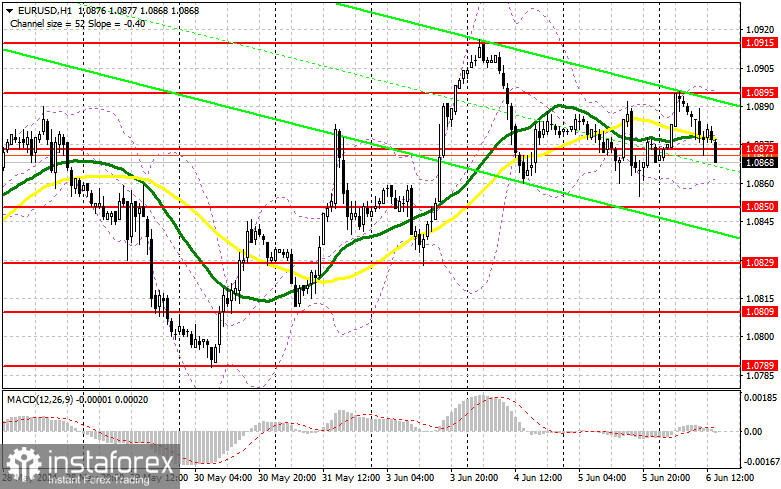
We discussed the potential reaction to the ECB meeting in detail in the morning forecast. Now, I would like to focus more on the data coming from the US. Figures on initial jobless claims and the trade balance are expected. These indicators are unlikely to significantly affect the dollar's direction if there are serious changes in ECB policy, so it's safe to ignore the data. In the case of further pair decline, only a false breakout formation around 1.0850 will give an entry point for long positions, capable of returning EUR/USD to the level of 1.0873, where the moving averages slightly favor the sellers. A breakthrough and update from top to bottom of 1.0773, against the backdrop of the ECB's hawkish stance, will strengthen the pair with a chance to jump to 1.0895. The farthest target will be the new monthly high of 1.0915, where I will take profit. If EUR/USD declines during Christine Lagarde's speech and there is no activity around 1.0850 in the second half of the day, trading will shift within a new downward channel, which will significantly increase pressure on the euro and lead to a pair drop. In this case, I will enter only after forming a false breakout around the next support at 1.0829. I plan to open long positions immediately on a rebound from 1.0809 with the aim of an upward correction of 30-35 points within the day.
For opening short positions on EUR/USD:
Sellers have a chance to regain market control, but this requires good statistics from the US and a dovish ECB stance, which is unlikely in the face of the risk of sustained inflationary pressure. It is better to wait for a false breakout around the resistance at 1.0873 before selling. This will give an entry point for short positions with the prospect of a euro decline and updating support at 1.0850. A breakthrough and consolidation below this range and a retest from the bottom up will provide another selling point, with the pair moving towards the minimum of 1.0829, where I expect to see more active buyer participation. The farthest target will be the minimum of 1.0809, where I will take profit. If EUR/USD rises in the second half of the day and there are no bears around 1.0895, buyers will have a chance to continue the pair's growth. In this case, I will postpone selling until the next resistance test at 1.0915. I will also sell there, but only after a failed consolidation. I plan to open short positions immediately on a rebound from 1.0942 with the aim of a downward correction of 30-35 points.
Indicator signals:
Moving Averages:
Trading is below the 30 and 50-day moving averages, indicating market uncertainty.
Note: The author considers the period and prices of moving averages on the hourly H1 chart, which differs from the classic daily moving averages on the D1 chart.
Bollinger Bands:
In case of a decline, the lower boundary of the indicator, around 1.0865, will act as support.
Indicator Descriptions:
*The market analysis posted here is meant to increase your awareness, but not to give instructions to make a trade.
InstaSpot analytical reviews will make you fully aware of market trends! Being an InstaSpot client, you are provided with a large number of free services for efficient trading.


