


Our team has over 7,000,000 traders!
Every day we work together to improve trading. We get high results and move forward.
Recognition by millions of traders all over the world is the best appreciation of our work! You made your choice and we will do everything it takes to meet your expectations!
We are a great team together!
InstaSpot. Proud to work for you!


Actor, UFC 6 tournament champion and a true hero!
The man who made himself. The man that goes our way.
The secret behind Taktarov's success is constant movement towards the goal.
Reveal all the sides of your talent!
Discover, try, fail - but never stop!
InstaSpot. Your success story starts here!

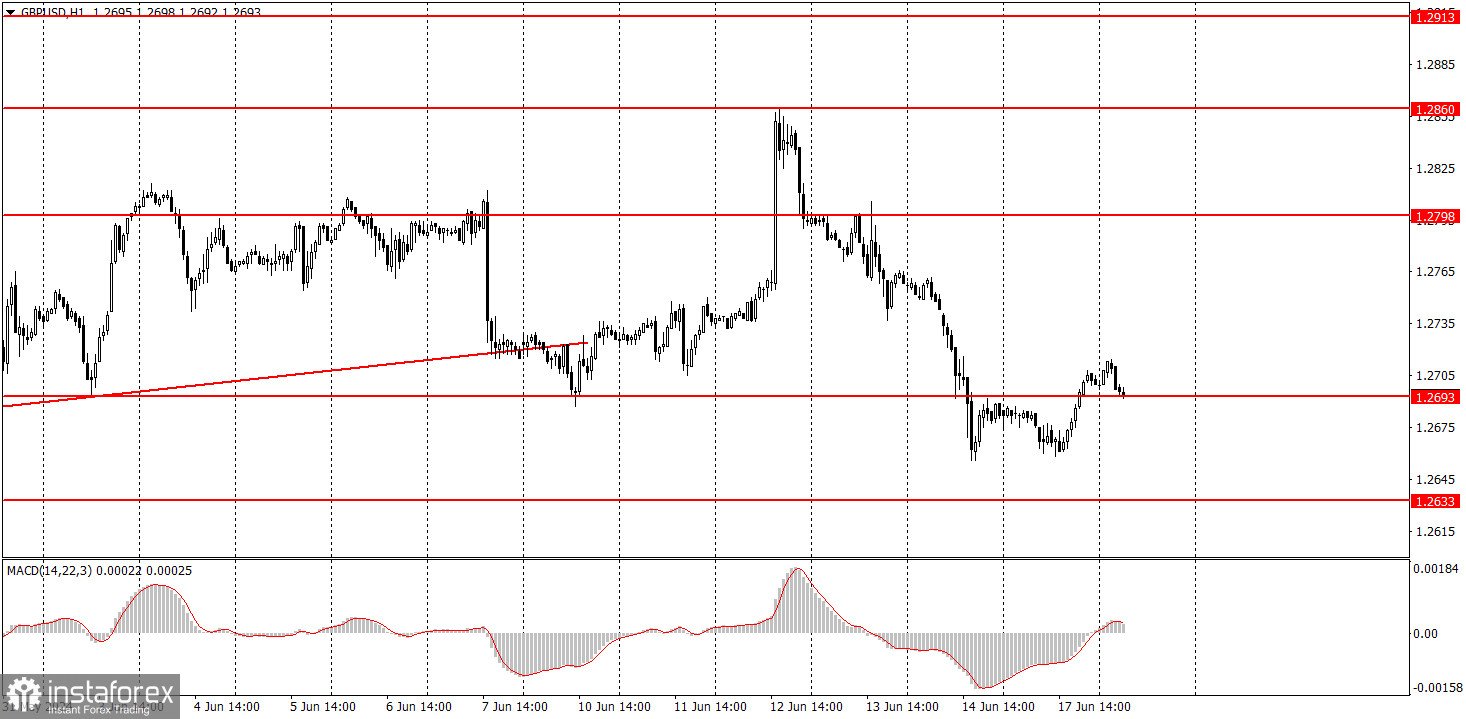
GBP/USD also went through a correction on Monday, but unlike the EUR/USD pair, it didn't have any reason to do so. The euro is in a downward trend, so upward retracements are normal. However, the British pound is moving sideways, trading quite erratically and still refuses to show any significant declines. Last week, the price managed to settle below the level of 1.2693, which could be considered a support line that prevented the British currency from falling for several weeks. It seemed like the long-awaited downtrend would begin, but on Monday, in the complete absence of any fundamental or macroeconomic information, the pound calmly settled above this level. Therefore, we still have significant doubts that the pound is capable of showing any downward movement. The Bank of England meeting is scheduled for Thursday, and the UK inflation report will be released tomorrow. Take note that the market may use any formal pretext to buy the British currency.
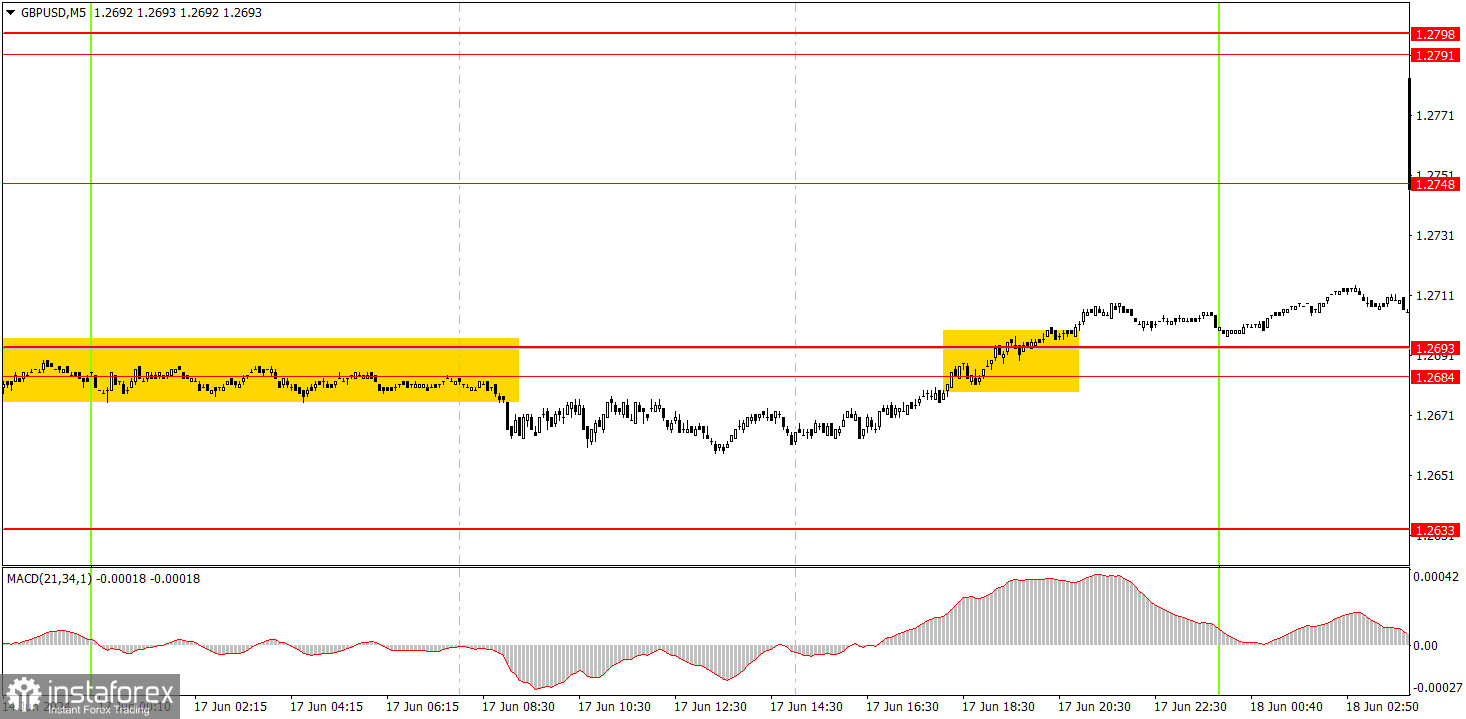
Two trading signals were generated on the 5-minute timeframe. In the morning, traders could consider opening short positions, but the pair's decline did not last long. At best, the trade could be closed to breakeven since the price did not even approach the target level. Late in the evening, the price broke through the 1.2684-1.2693 area, which served as a buy signal. Therefore, as long as the price remains above this area, you may trade on the rise with 1.2748 as the target.
On the hourly chart, the GBP/USD pair has great prospects for forming a downward trend, although the uptrend still persists. It is a good thing that the price managed to break below the level of 1.2693 on Friday; however, the pound climbed above this level once again. The market frequently refrains from selling the pound, even if there are technical, fundamental, and macroeconomic reasons to do so.
On Tuesday, we would advise you to closely monitor the area of 1.2684-1.2693. Long positions are valid, but if the price settles below this area for the second time, it might be worth trying to sell the British pound again.
The key levels on the 5M chart are 1.2457, 1.2502, 1.2541-1.2547, 1.2605-1.2633, 1.2684-1.2693, 1.2748, 1.2791-1.2798, 1.2848-1.2860, 1.2913, and 1.2980. Today, there is nothing to highlight in the UK economic calendar. Meanwhile, the U.S. docket will feature reports on retail sales and industrial production. Therefore, the pair may show more volatility during the U.S. session, which is always a good thing for traders.
1) Signal strength is determined by the time taken for its formation (either a bounce or level breach). A shorter formation time indicates a stronger signal.
2) If two or more trades around a certain level are initiated based on false signals, subsequent signals from that level should be disregarded.
3) In a flat market, any currency pair can produce multiple false signals or none at all. In any case, the flat trend is not the best condition for trading.
4) Trading activities are confined between the onset of the European session and mid-way through the U.S. session, after which all open trades should be manually closed.
5) On the 30-minute timeframe, trades based on MACD signals are only advisable amidst substantial volatility and an established trend, confirmed either by a trendline or trend channel.
6) If two levels lie closely together (ranging from 5 to 15 pips apart), they should be considered as a support or resistance zone.
Support and Resistance price levels can serve as targets when buying or selling. You can place Take Profit levels near them.
Red lines represent channels or trend lines, depicting the current market trend and indicating the preferable trading direction.
The MACD(14,22,3) indicator, encompassing both the histogram and signal line, acts as an auxiliary tool and can also be used as a signal source.
Significant speeches and reports (always noted in the news calendar) can profoundly influence the price dynamics. Hence, trading during their release calls for heightened caution. It may be reasonable to exit the market to prevent abrupt price reversals against the prevailing trend.
Beginners should always remember that not every trade will yield profit. Establishing a clear strategy coupled with sound money management is the cornerstone of sustained trading success.
*The market analysis posted here is meant to increase your awareness, but not to give instructions to make a trade.
InstaSpot analytical reviews will make you fully aware of market trends! Being an InstaSpot client, you are provided with a large number of free services for efficient trading.


