


Our team has over 7,000,000 traders!
Every day we work together to improve trading. We get high results and move forward.
Recognition by millions of traders all over the world is the best appreciation of our work! You made your choice and we will do everything it takes to meet your expectations!
We are a great team together!
InstaSpot. Proud to work for you!


Actor, UFC 6 tournament champion and a true hero!
The man who made himself. The man that goes our way.
The secret behind Taktarov's success is constant movement towards the goal.
Reveal all the sides of your talent!
Discover, try, fail - but never stop!
InstaSpot. Your success story starts here!

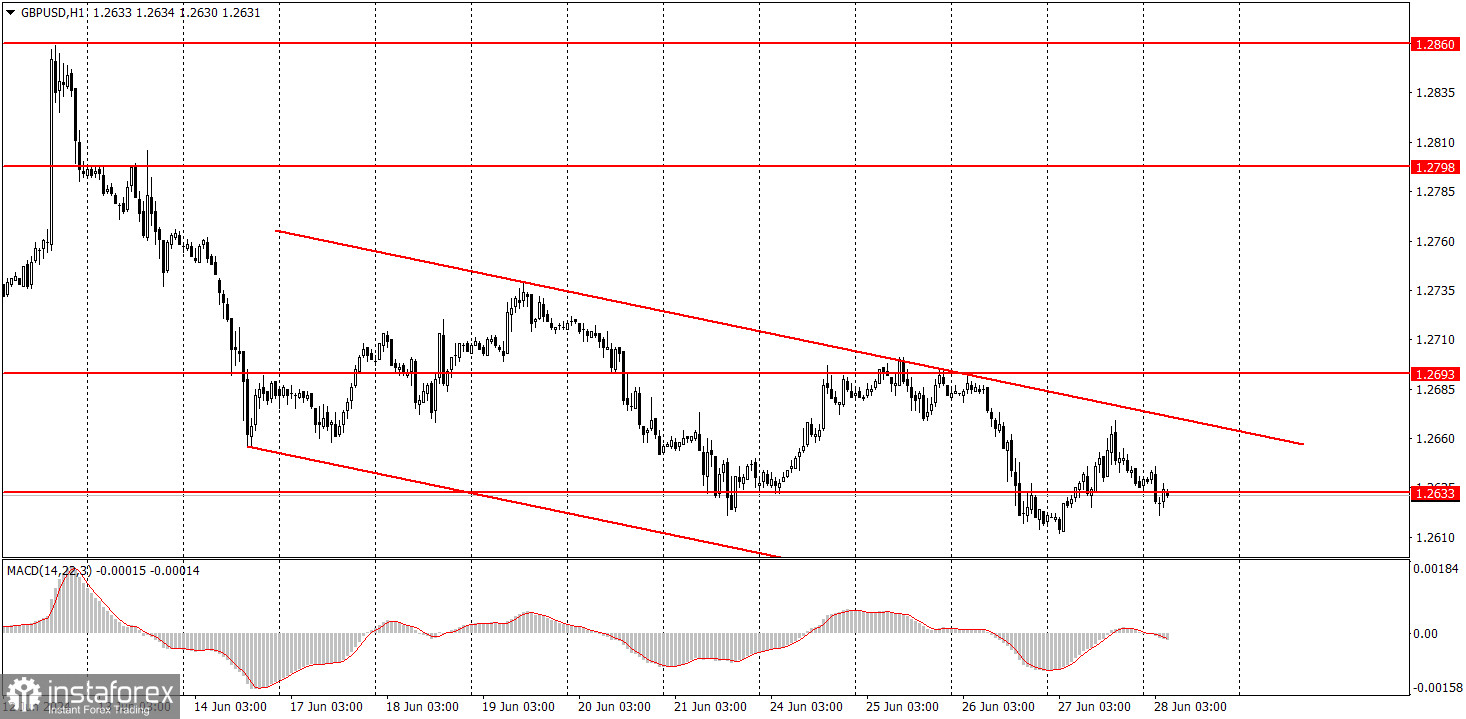
Yesterday, the GBP/USD pair managed to rise and fall within a descending channel. The pound's technical picture is somewhat different from that of the euro. There are also signs of sideways movement, but the pound is gradually moving downward. Of course, it would be better if the pound immediately started a sharper decline, and volatility to be much higher than current levels. However, our desires do not always match the market's capabilities.
Yesterday, the British pound received minor support from US macro data, but even without this, it would still have shown growth. The pair goes through a correction quite often, so upward retracements happen even without economic reasons. Overall, we expect the pound to fall, but the market is in no hurry to sell, so at best, we can observe a sluggish decline in quotes.
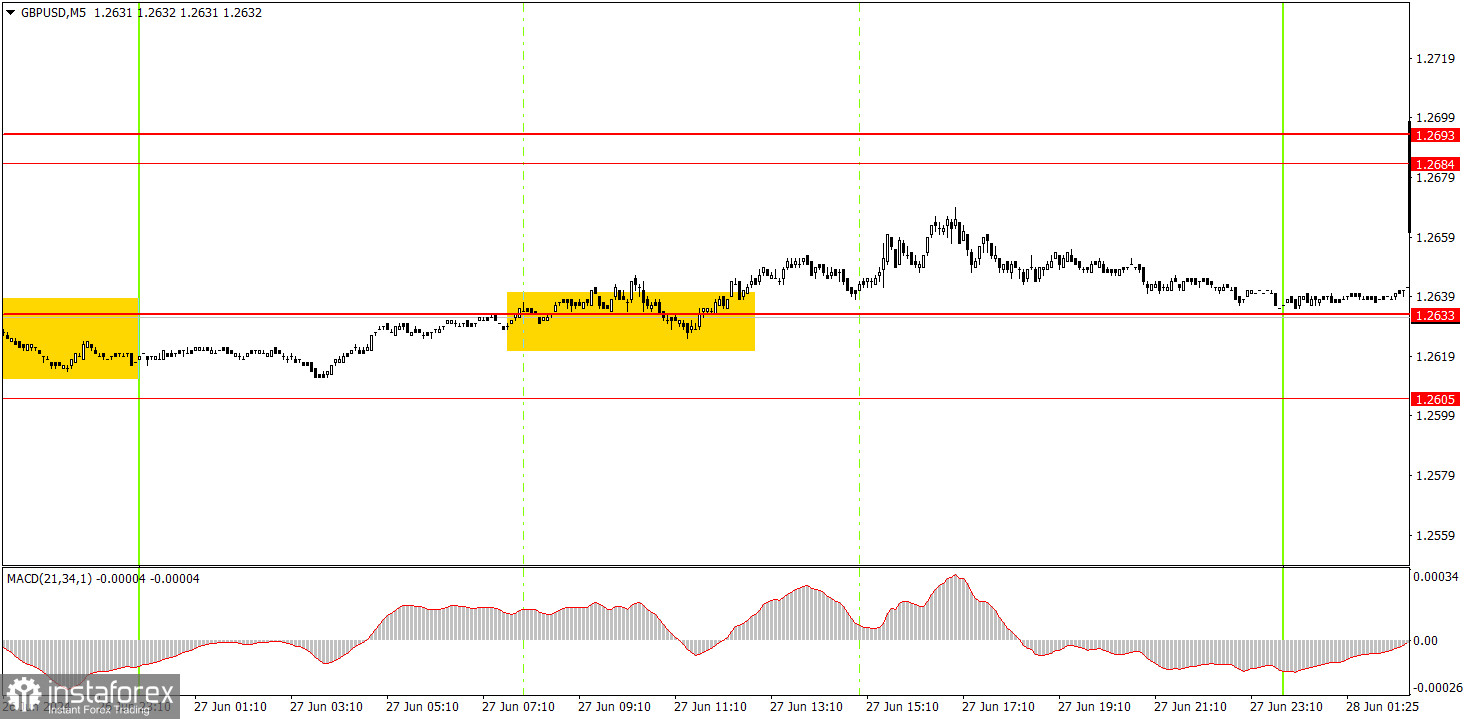
One buy signal was formed on the 5-minute timeframe, but due to weak volatility, the price failed to reach the target level. During the European session, the price breached the level of 1.2633, after which it managed to climb about 25 pips. In general, the situation is now such that if you see a profit of more than 15 pips on your trade, you can already close the deal and be happy about it. By the end of the day, the price returned to the level of 1.2633...
On the hourly chart, GBP/USD continues to show promising signs of forming a downtrend, although this doesn't mean that the pair can't form an uptrend. In regards to the bearish prospects, it's a good thing that the price managed to overcome the 1.2693 level twice; However, the market often refuses to sell, even in the presence of technical, fundamental, and macroeconomic factors favoring such a direction. Even now, it is clear that each new low is only slightly lower than the previous one, and corrections are quite frequent. This indicates the weakness of the downward trend.
On Friday, the British pound may continue to exhibit erratic and illogical movements. GBP/USD may continue to fall, but several reports will be released in Britain and America, and these could weigh on the dollar.
The key levels on the 5M chart are 1.2457, 1.2502, 1.2541-1.2547, 1.2605-1.2633, 1.2684-1.2693, 1.2748, 1.2791-1.2798, 1.2848-1.2860, 1.2913, 1.2980. Today, the UK will post the third estimate of its GDP numbers for Q1. The US will release the PCE index and the University of Michigan's consumer sentiment index. These are relatively secondary reports, but with the current volatility of the pair, they can leave their mark on the charts.
1) Signal strength is determined by the time taken for its formation (either a bounce or level breach). A shorter formation time indicates a stronger signal.
2) If two or more trades around a certain level are initiated based on false signals, subsequent signals from that level should be disregarded.
3) In a flat market, any currency pair can produce multiple false signals or none at all. In any case, the flat trend is not the best condition for trading.
4) Trading activities are confined between the onset of the European session and mid-way through the U.S. session, after which all open trades should be manually closed.
5) On the 30-minute timeframe, trades based on MACD signals are only advisable amidst substantial volatility and an established trend, confirmed either by a trendline or trend channel.
6) If two levels lie closely together (ranging from 5 to 15 pips apart), they should be considered as a support or resistance zone.
Support and Resistance price levels can serve as targets when buying or selling. You can place Take Profit levels near them.
Red lines represent channels or trend lines, depicting the current market trend and indicating the preferable trading direction.
The MACD(14,22,3) indicator, encompassing both the histogram and signal line, acts as an auxiliary tool and can also be used as a signal source.
Significant speeches and reports (always noted in the news calendar) can profoundly influence the price dynamics. Hence, trading during their release calls for heightened caution. It may be reasonable to exit the market to prevent abrupt price reversals against the prevailing trend.
Beginners should always remember that not every trade will yield profit. Establishing a clear strategy coupled with sound money management is the cornerstone of sustained trading success.
*The market analysis posted here is meant to increase your awareness, but not to give instructions to make a trade.
InstaSpot analytical reviews will make you fully aware of market trends! Being an InstaSpot client, you are provided with a large number of free services for efficient trading.


