


Our team has over 7,000,000 traders!
Every day we work together to improve trading. We get high results and move forward.
Recognition by millions of traders all over the world is the best appreciation of our work! You made your choice and we will do everything it takes to meet your expectations!
We are a great team together!
InstaSpot. Proud to work for you!


Actor, UFC 6 tournament champion and a true hero!
The man who made himself. The man that goes our way.
The secret behind Taktarov's success is constant movement towards the goal.
Reveal all the sides of your talent!
Discover, try, fail - but never stop!
InstaSpot. Your success story starts here!

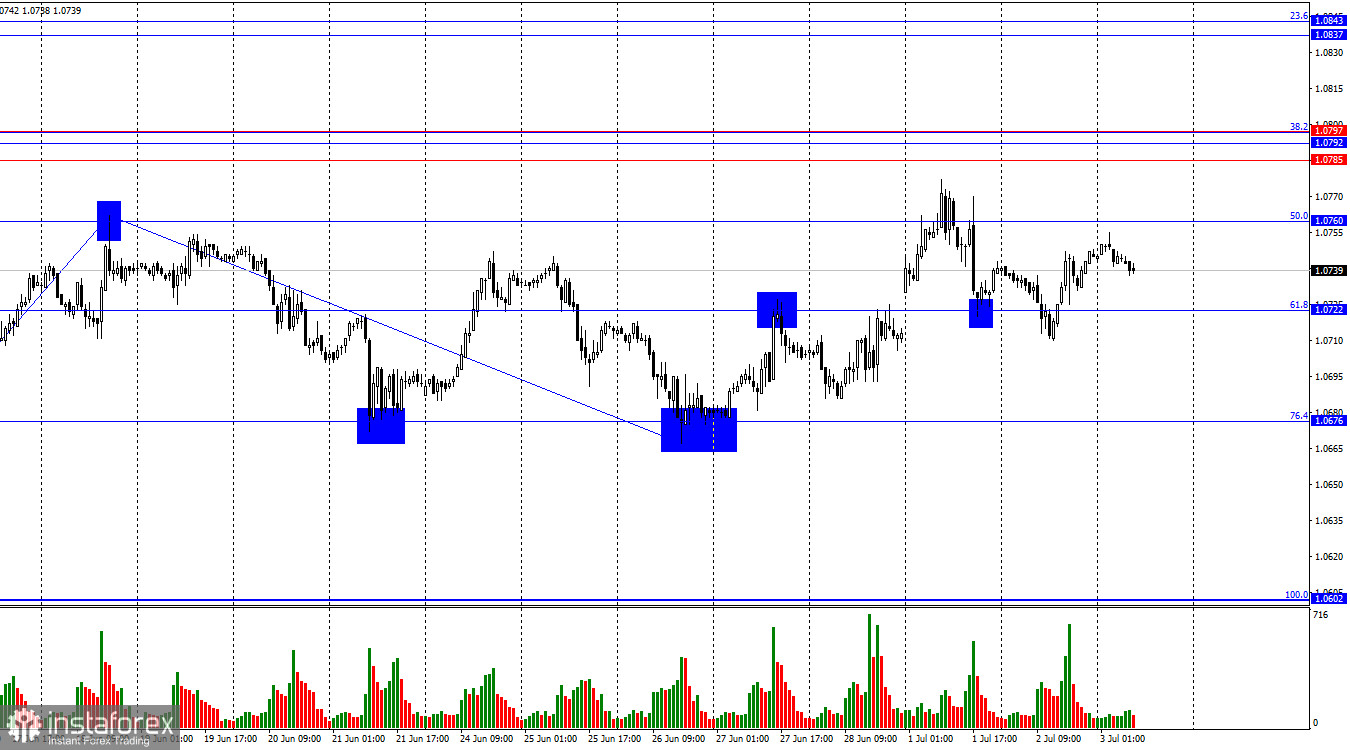
On Tuesday, the EUR/USD pair fell to the corrective level of 61.8% (1.0722) and then reversed in favor of the euro. As of Wednesday morning, the quotes rose to the 50.0% Fibonacci level at 1.0760. A rebound of the pair from this level will favor the US dollar and some decline towards the levels of 1.0722 and 1.0676. Consolidation above the 1.0760 level will allow for further growth towards the important resistance zone of 1.0785–1.0797.
The wave situation has become more complicated this week. A new upward wave has broken the peak of the previous wave, but the breakout is weak, and the informational background does not clearly support the bulls. The last completed downward wave failed to break the low of the previous wave, which could be considered a sign of a trend change from "bearish" to "bullish." We have two such signs, but I also want to draw traders' attention to the fact that just a few points broke the last peak from June 18. I would say that we are currently dealing with horizontal movement rather than a trend change to "bullish."
The informational background on Tuesday was quite interesting. In the end, the euro showed a slight increase, which can be considered the market's reaction to the EU inflation report and Christine Lagarde's speech. I also note the JOLTS report, which was slightly better than forecasts but at the same time worse than its previous value, which was revised. Yesterday's moderate rise in the pair corresponded to the informational background, which weakly supported the bulls. The situation may change by the end of the week, and the bears may go on the offensive. However, I do not expect strong movements today, as the market is generally not ready for active action. There are many reports today, and each of them can cause a reaction. This means that we might see quite a few reversals throughout the day.
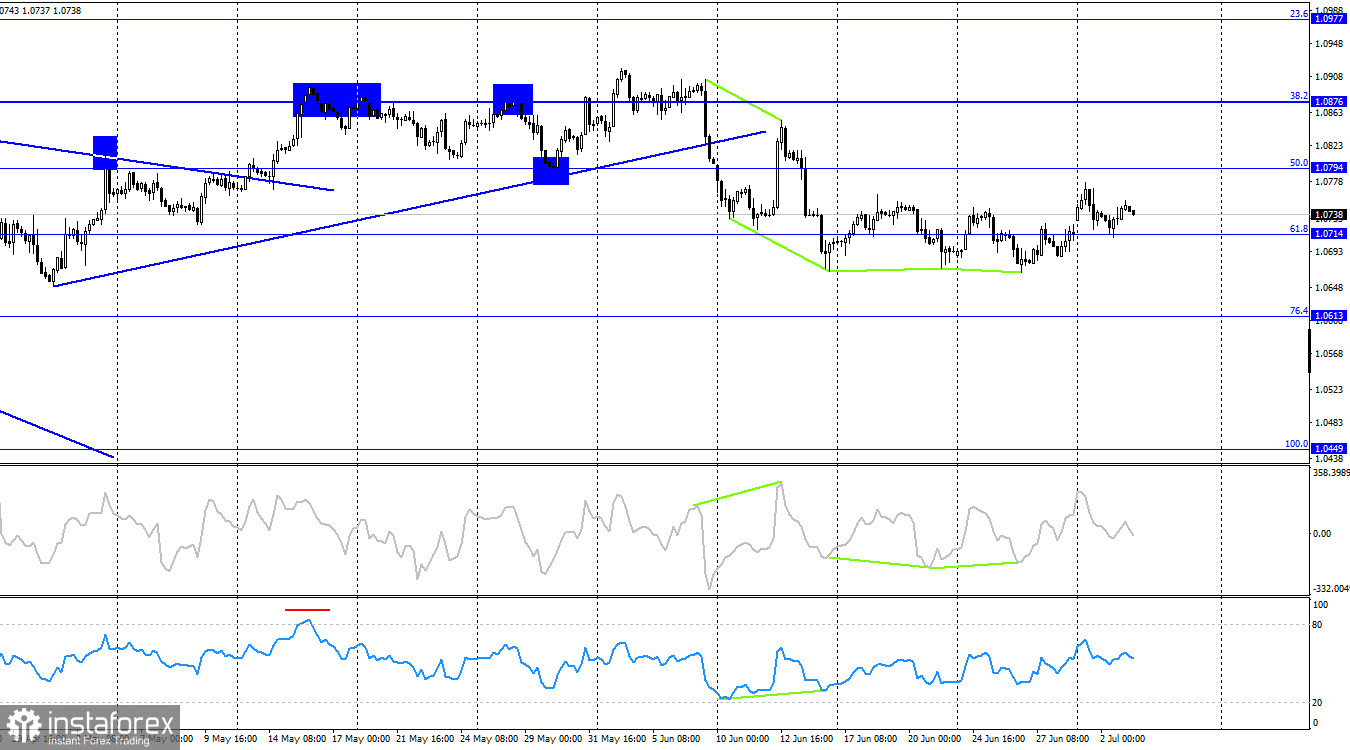
On the 4-hour chart, the pair made a new reversal in favor of the euro after forming a new "bullish" divergence on the CCI indicator. On the 4-hour chart a week ago, there was a close below the trendline, which changed trader sentiment to "bearish." Thus, any "bullish" divergences (in my opinion) are signals of a correction. On the hourly chart, we have signs of a trend change to "bullish," but I would not rush to such conclusions.
Commitments of Traders (COT) report:
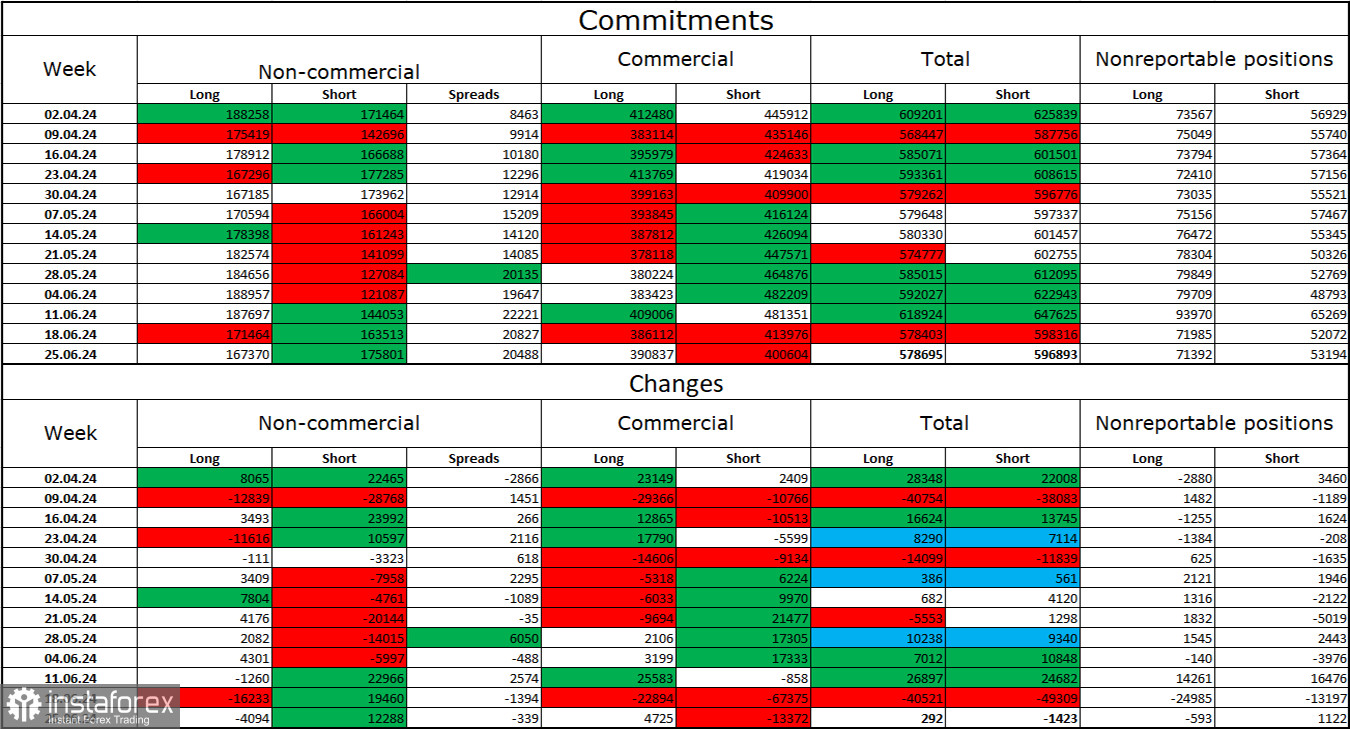
During the last reporting week, speculators closed 4,094 long positions and opened 12,288 short positions. The sentiment of the "Non-commercial" group turned "bearish" a few weeks ago and is currently intensifying. The total number of long positions held by speculators is now 167,000, while the number of short positions is 175,000.
The situation will continue to favor the bears. I do not see any long-term reasons to buy the euro, as the ECB has begun easing monetary policy, which will reduce the yields on bank deposits and government bonds. In the U.S., however, they will remain high for at least several more months, making the dollar more attractive to investors. The potential for a decline in the euro even looks significant, according to the COT reports. At present, the number of short positions among professional players is increasing.
Eurozone:
USA:
The economic events calendar again includes many important entries on July 3. The news background can influence trader sentiment throughout the day, but trader activity remains weak.
Selling the pair is possible upon a rebound on the hourly chart from the 1.0760 level, with targets at 1.0722 and 1.0676. Alternatively, selling from the 1.0785 – 1.0797 zone with the same targets is also possible. I see few reasons for buying amid a fully horizontal movement. I believe it's not worth risking with buys now.
The Fibonacci grids are built from 1.0602 to 1.0917 on the hourly chart and from 1.0450 to 1.1139 on the 4-hour chart.
*The market analysis posted here is meant to increase your awareness, but not to give instructions to make a trade.
InstaSpot analytical reviews will make you fully aware of market trends! Being an InstaSpot client, you are provided with a large number of free services for efficient trading.


