


Our team has over 7,000,000 traders!
Every day we work together to improve trading. We get high results and move forward.
Recognition by millions of traders all over the world is the best appreciation of our work! You made your choice and we will do everything it takes to meet your expectations!
We are a great team together!
InstaSpot. Proud to work for you!


Actor, UFC 6 tournament champion and a true hero!
The man who made himself. The man that goes our way.
The secret behind Taktarov's success is constant movement towards the goal.
Reveal all the sides of your talent!
Discover, try, fail - but never stop!
InstaSpot. Your success story starts here!

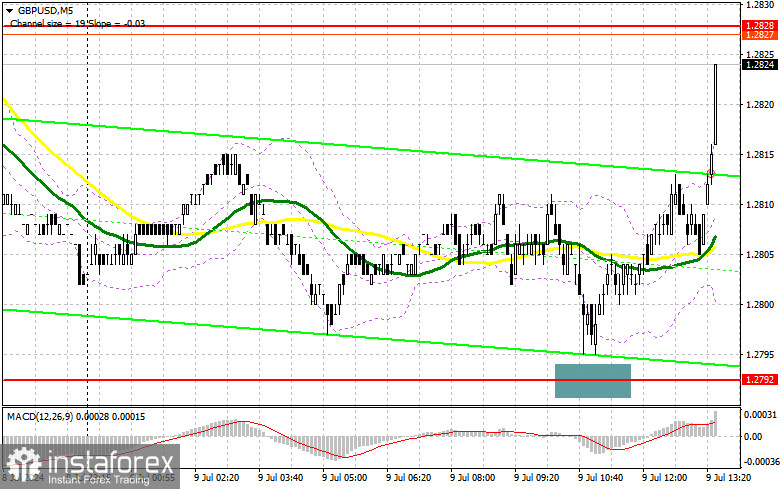
In my morning forecast, I highlighted the level of 1.2792 and planned to make trading decisions based on it. Let's look at the 5-minute chart and see what happened. The price dropped but fell just short of testing 1.2792 by a couple of points, so I missed the market entry and the subsequent upward move in GBP/USD, which updated the level of 1.2828. The technical picture was slightly revised for the second half of the day.
For opening long positions on GBP/USD:
Given the lack of statistics from the UK and the continued demand for the British pound, it is best to trade in continuation of the bullish trend. However, in the second half of the day, Federal Reserve Chairman Jerome Powell's speech could significantly affect the pound's prospects. Therefore, it is advisable to listen to Powell's comments and continue opening long positions if the market moves in the expected direction and trend. In case of a negative reaction to his statements, I will look to buy around the new support at 1.2796, formed by the morning's movements. A false breakout at this level will provide a good entry point for long positions with the prospect of updating the maximum at 1.2831. A breakout and retest of this range from top to bottom will strengthen the pound's bullish potential, leading to an entry point for long positions aiming for 1.2858. The furthest target will be the area of 1.2890, where I plan to take profits. If GBP/USD declines and there is no activity from the bulls at 1.2796 in the second half of the day, the pressure on the pair will increase. This will also lead to a drop and an update of the next support at 1.2764, increasing the chances of a bearish correction. Therefore, only a false breakout will be suitable for opening long positions. I plan to buy GBP/USD immediately on a rebound from the low of 1.2734 with the aim of a 30-35 point intraday correction.
For opening short positions on GBP/USD:
Sellers tried, but few believe that the Federal Reserve will continue to "tighten the screws," especially during Jerome Powell's speech in Congress. Therefore, I will only consider new short positions after defending the nearest resistance at 1.2831, formed by yesterday's results. A false breakout at this level will be a suitable option for opening short positions to decline to the support at 1.2796, where the moving averages, favoring the bulls, are located. A breakout and retest of this range from bottom to top will hit the buyers' positions, triggering stop orders and opening the way to 1.2764. The furthest target will be the area of 1.2734, where I plan to take profits. Testing this level will severely damage the pound's bullish potential. If GBP/USD rises and there is no activity at 1.2831 in the second half of the day, buyers will have a chance to continue the uptrend. In this case, I will postpone sales until a false breakout at 1.2858. If there is no downward movement, I will sell GBP/USD immediately on a rebound from 1.2890, but only expecting a 30-35 point intraday correction.
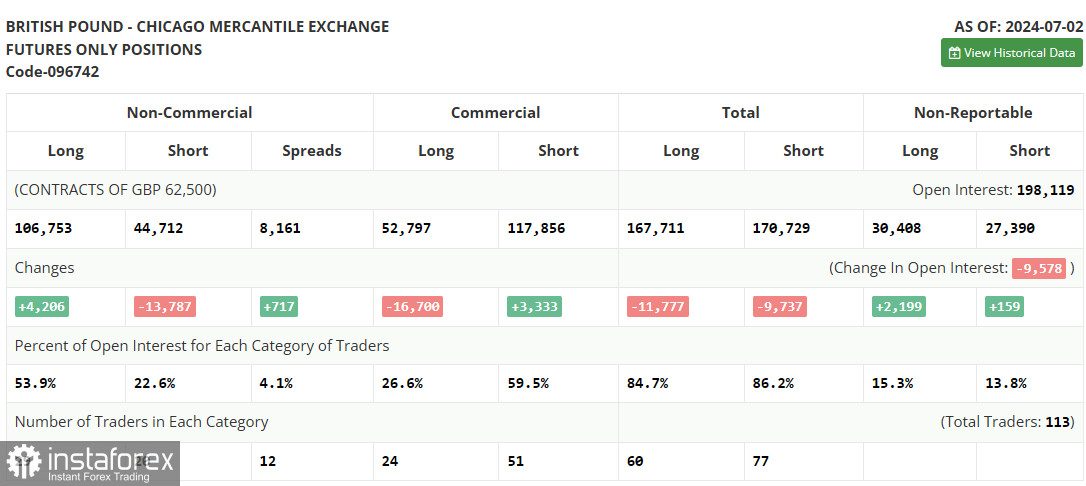
In the COT report (Commitment of Traders) for July 2, there was an increase in long positions and a decrease in short ones. Despite the Bank of England's comments on future policy and a potential rate cut in August this year, the pound has somewhat revived and recovered after a significant drop due to the high probability of divergent policies between the Bank of England and the Federal Reserve. Now traders are awaiting new guidance from the Fed, which comes from Jerome Powell's speech in Congress and US inflation data, which will set the direction for risk assets in the coming weeks, including the British pound. The latest COT report states that long non-commercial positions increased by 4,206 to 106,753, while short non-commercial positions fell by 13,787 to 44,712. As a result, the spread between long and short positions increased by 717.
Indicator Signals:
Moving Averages
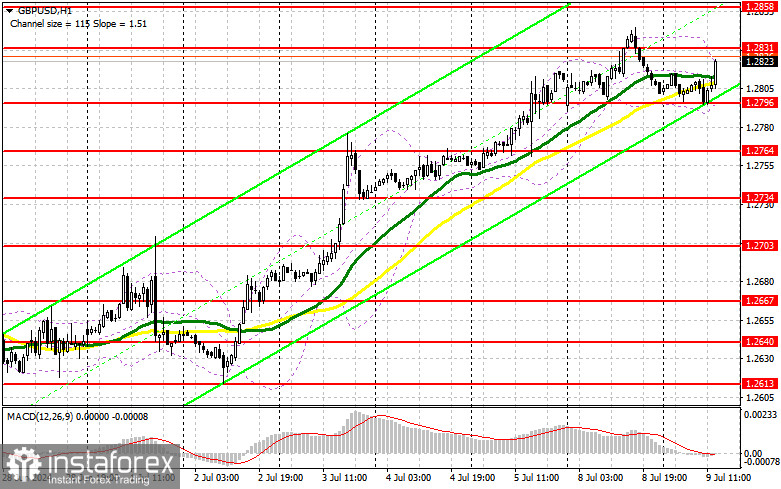
Trading is conducted above the 30 and 50-day moving averages, indicating further pair growth.
Note: The author considers the period and prices of the moving averages on the H1 hourly chart, which differs from the general definition of classic daily moving averages on the D1 daily chart.
Bollinger Bands
In case of a decline, the lower boundary of the indicator in the area of 1.2796 will act as support.
Description of Indicators
• Moving average (defines the current trend by smoothing volatility and noise). Period 50. Marked in yellow on the chart.
• Moving average (defines the current trend by smoothing volatility and noise). Period 30. Marked in green on the chart.
• MACD Indicator (Moving Average Convergence/Divergence) Fast EMA period 12. Slow EMA period 26. SMA period 9
• Bollinger Bands. Period 20
• Non-commercial traders - speculators such as individual traders, hedge funds, and large institutions using the futures market for speculative purposes and meeting certain requirements.
• Long non-commercial positions represent the total long open position of non-commercial traders.
• Short non-commercial positions represent the total short open position of non-commercial traders.
• The total non-commercial net position is the difference between short and long positions of non-commercial traders.
*The market analysis posted here is meant to increase your awareness, but not to give instructions to make a trade.
InstaSpot analytical reviews will make you fully aware of market trends! Being an InstaSpot client, you are provided with a large number of free services for efficient trading.


