


Our team has over 7,000,000 traders!
Every day we work together to improve trading. We get high results and move forward.
Recognition by millions of traders all over the world is the best appreciation of our work! You made your choice and we will do everything it takes to meet your expectations!
We are a great team together!
InstaSpot. Proud to work for you!


Actor, UFC 6 tournament champion and a true hero!
The man who made himself. The man that goes our way.
The secret behind Taktarov's success is constant movement towards the goal.
Reveal all the sides of your talent!
Discover, try, fail - but never stop!
InstaSpot. Your success story starts here!

GBP/USD struggled on Tuesday, as it only managed to fall by a few dozen pips during the European session. It is vital to mention that this is all happening near the previous local high and in the area from which the price has bounced about 10 times over the past seven months, if not more. We still don't know if the British pound can sustain its growth, but it is undeniable that it has been rising much more frequently in recent months. Part of this movement can be attributed to weak US economic reports. However, we have repeatedly mentioned that the state of the British economy is no better, and the "poor" values in the US reports are still much better than the "good" values in the UK data.
Furthermore, the Bank of England might start easing monetary policy as early as the next meeting. The current level of inflation allows for this. Core inflation is still too high, but the main inflation risks falling much below 2%, which the BoE cannot allow. We believe that the British central bank will start acting according to the European Central Bank's scheme. It will begin easing and then observe how both inflation indicators react. However, it should start lowering the rate in August, and the market cannot ignore this.
Thus, we can only suggest one thing: market makers are artificially driving up the pound sterling as high as possible to sell it at a better profit. Of course, this is just a hypothesis since we don't know what the big players are planning. However, the pound's movement over the past 7-8-9 months looks a bit strange. The pair seems glued to the 1.2763 level on the 24-hour timeframe and is constantly hovering around it. Fundamental factors are almost not being considered.
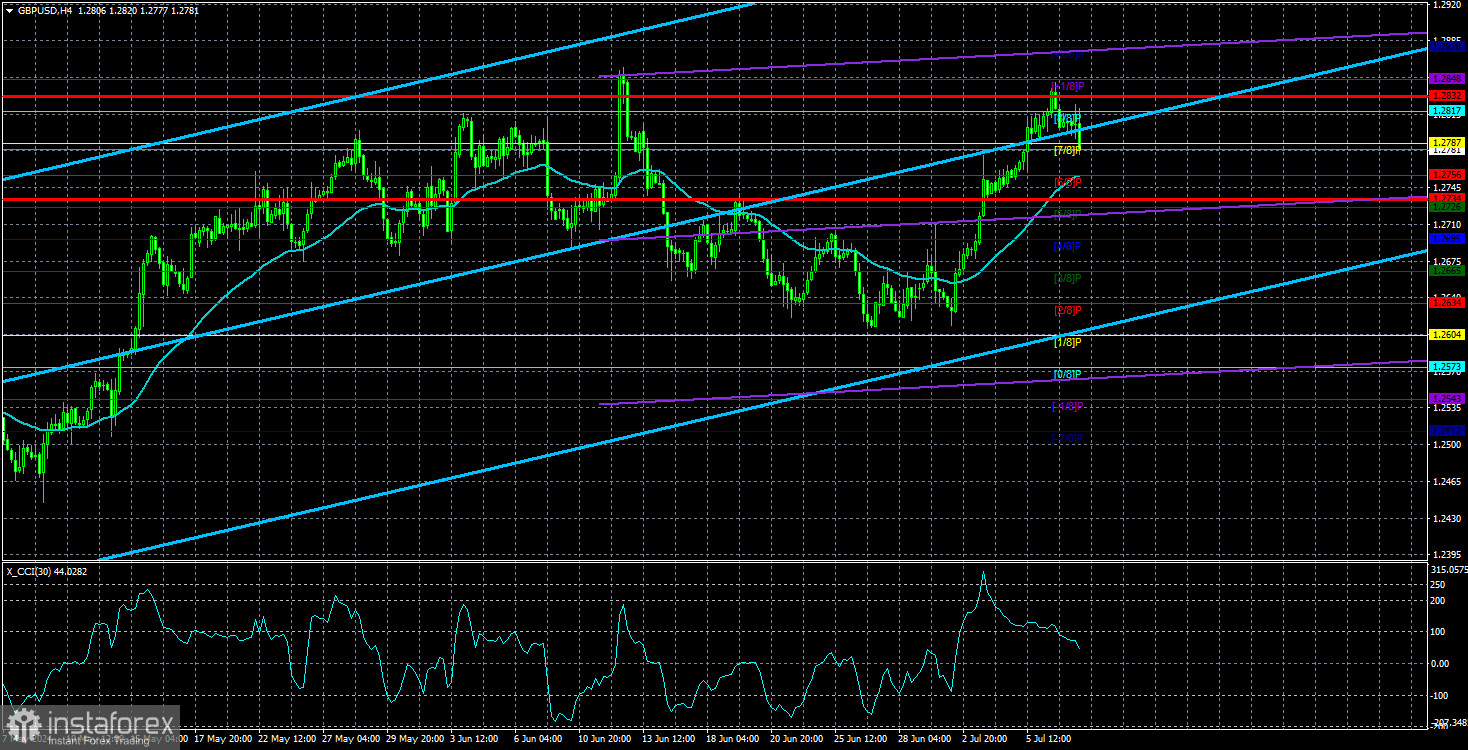
Therefore, we believe that the most logical step is for the pound to fall. Of course, traders who trade based on "pure" technical analysis might open long positions and may have a completely different perspective. However, we try to consider all factors, and not just technical ones. Even technically, there is no guarantee that the pair will continue to rise. The pair is at the upper boundary of the horizontal channel on the daily timeframe. It is logical to assume that without strong fundamental support, the price will not be able to break through this area. Alternatively, we might see another false breakout followed by a decline.
This week, the pair will depend on the US inflation report. But it seems that even a new drop in the US Consumer Price Index has long been priced in by the market. The pound is in a very ambiguous position, where a new portion of bearish or dovish information from the US might simply not lead to the dollar's decline. In any case, on the 4-hour timeframe, we do not have sell signals or signs indicating a downward trend.
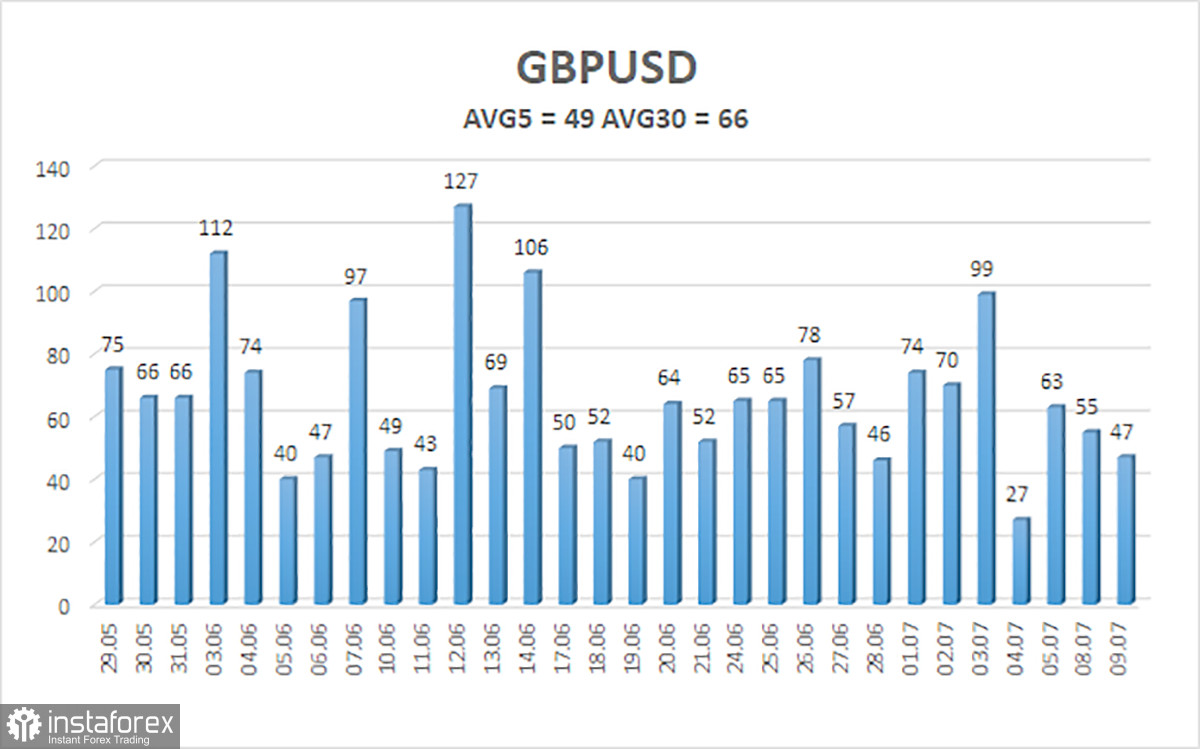
The average volatility of GBP/USD over the last five trading days is 49 pips. This is considered an average value for the pair. Today, we expect GBP/USD to move within a range bounded by the levels of 1.2734 and 1.2832. The higher linear regression channel is pointing upwards, which suggests that the upward trend will continue. Last week, the CCI indicator entered the overbought area and drew divergence from the last two highs, indicating an impending decline.
S1 - 1.2787
S2 - 1.2756
S3 - 1.2726
R1 - 1.2817
R2 - 1.2848
R3 - 1.2878
The GBP/USD pair continues to rise rapidly, ignoring all factors in favor of the dollar. Although the US released quite a number of disappointing data last week, we believe that this isn't enough for the pound to sustain its growth. We don't see how the pound would be able to rise above the level of 1.2817. Yes, a new batch of weak (relative to overestimated forecasts) US data may exert a significant amount of pressure on the dollar once again, and in addition to that the fundamental background, the policy of the Federal Reserve and the BoE no longer carries significant weight for the market. Therefore, we cannot say that long positions are the obvious choice at this time.
*The market analysis posted here is meant to increase your awareness, but not to give instructions to make a trade.
InstaSpot analytical reviews will make you fully aware of market trends! Being an InstaSpot client, you are provided with a large number of free services for efficient trading.


