


Our team has over 7,000,000 traders!
Every day we work together to improve trading. We get high results and move forward.
Recognition by millions of traders all over the world is the best appreciation of our work! You made your choice and we will do everything it takes to meet your expectations!
We are a great team together!
InstaSpot. Proud to work for you!


Actor, UFC 6 tournament champion and a true hero!
The man who made himself. The man that goes our way.
The secret behind Taktarov's success is constant movement towards the goal.
Reveal all the sides of your talent!
Discover, try, fail - but never stop!
InstaSpot. Your success story starts here!

Last week, the S&P 500 fell by 2.95% from its record peak, forming a divergence with the Marlin oscillator on the weekly chart. Fibonacci rays indirectly confirm the peak and reversal. Our task is to determine the timing and depth of the ongoing correction.
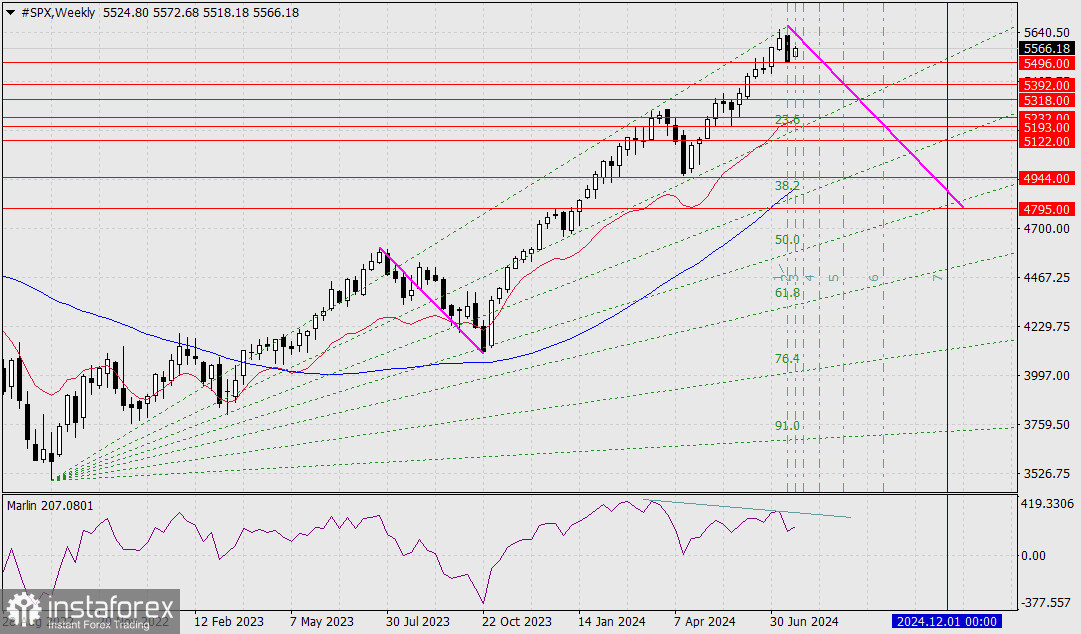
On the weekly chart, there is a magnetic point at the intersection of four lines: the 50% Fibonacci ray, the target level of 4795 – the peak of December 2023, the trendline from the July-October 2023 correction, and the Fibonacci timeline of order number 7. This gives us a timeframe of late November to early December of the current year. This period will coincide with the conclusion of the U.S. presidential elections and the announcement of the new president's plans, whoever that may be. Therefore, the index could hit new record highs when the S&P 500 falls 15.4% from its all-time high at 4795.
Intermediate targets on the way to 4795:
*The market analysis posted here is meant to increase your awareness, but not to give instructions to make a trade.
InstaSpot analytical reviews will make you fully aware of market trends! Being an InstaSpot client, you are provided with a large number of free services for efficient trading.


