


Our team has over 7,000,000 traders!
Every day we work together to improve trading. We get high results and move forward.
Recognition by millions of traders all over the world is the best appreciation of our work! You made your choice and we will do everything it takes to meet your expectations!
We are a great team together!
InstaSpot. Proud to work for you!


Actor, UFC 6 tournament champion and a true hero!
The man who made himself. The man that goes our way.
The secret behind Taktarov's success is constant movement towards the goal.
Reveal all the sides of your talent!
Discover, try, fail - but never stop!
InstaSpot. Your success story starts here!


Today, the precious metal is gaining some positive momentum and appears to have halted a two-day losing streak in response to US macroeconomic data. The better-than-expected GDP report released on Thursday aligned with the view of a strong economy. According to additional data, inflation slowed in the second quarter of 2024, bringing some stability to financial markets. Consequently, this diverted funds away from the traditionally safe-haven precious metal.
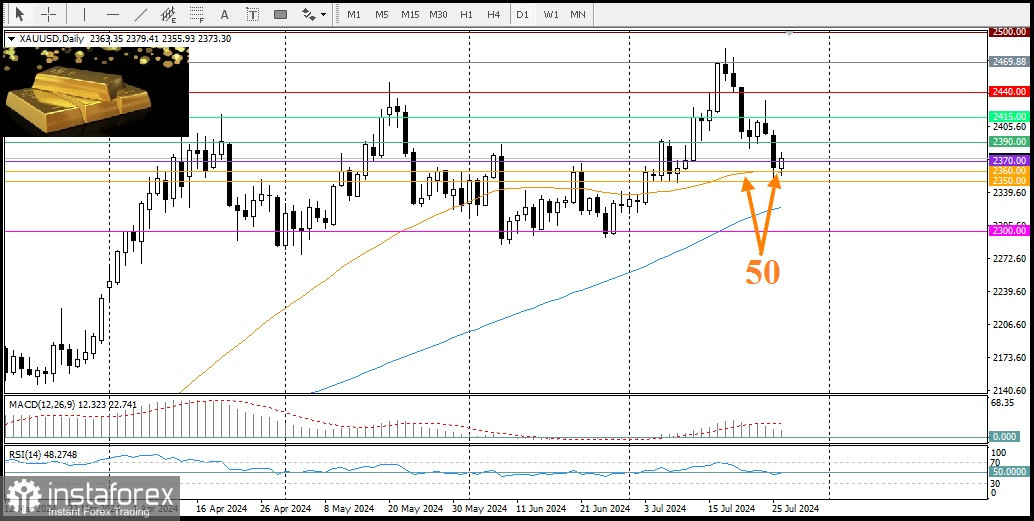
However, amid expectations that the Federal Reserve will begin its rate-cutting cycle in September, the XAU/USD pair has shown some resilience below the 50-day Simple Moving Average (SMA)
These expectations also keep the US dollar below the two-week high reached on Wednesday, helping gold attract some buyers. Nevertheless, the upward potential remains limited as traders await the release of the US Personal Consumption Expenditures (PCE) price index later today during the American session for cues on Fed policy. This could spur demand for the US dollar, putting new pressure on the non-yielding yellow metal.
From a technical perspective, gold has shown some resilience for the second consecutive day below the 50-day SMA, seemingly breaking a two-day losing streak. Therefore, some selling below the overnight swing low around $2355 is necessary to support the prospects of continuing the recent corrective decline from the historic high reached last week.
Additionally, the oscillators on the daily chart have just started gaining negative momentum, suggesting that the path of least resistance for XAU/USD is downward. Any further recovery is likely to attract new sellers around the $2380 level, the upper boundary of the overnight swing. The next major resistance is at the $2390 level, followed by the $2400 level. A breakthrough above these levels could trigger a new wave of short-covering, potentially driving the metal up to the weekly high near $2432 level.
If the price drops below the 50-day SMA and breaks through the $2350 level, it would indicate a new bearish signal. Subsequently, gold may test the 100-day SMA, which is currently around the $2325 level and expected to provide key support. However, a breach of this level could lead to further declines, potentially testing levels below $2300 or the June monthly swing lows.
*The market analysis posted here is meant to increase your awareness, but not to give instructions to make a trade.
InstaSpot analytical reviews will make you fully aware of market trends! Being an InstaSpot client, you are provided with a large number of free services for efficient trading.


