


Our team has over 7,000,000 traders!
Every day we work together to improve trading. We get high results and move forward.
Recognition by millions of traders all over the world is the best appreciation of our work! You made your choice and we will do everything it takes to meet your expectations!
We are a great team together!
InstaSpot. Proud to work for you!


Actor, UFC 6 tournament champion and a true hero!
The man who made himself. The man that goes our way.
The secret behind Taktarov's success is constant movement towards the goal.
Reveal all the sides of your talent!
Discover, try, fail - but never stop!
InstaSpot. Your success story starts here!

EUR/USD
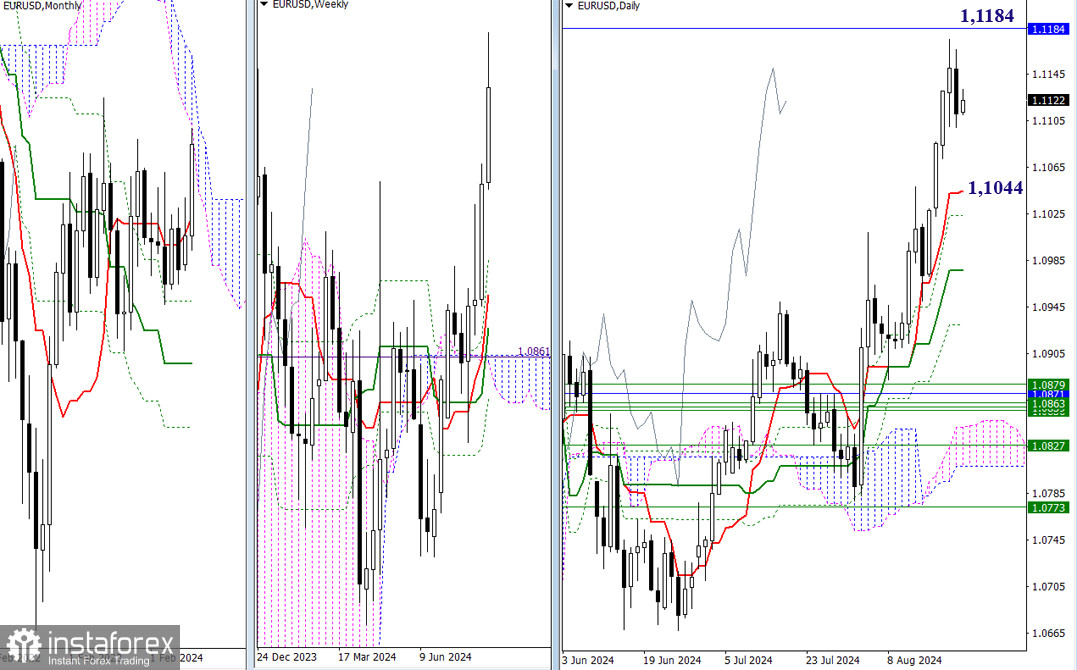
Higher time frames
Even though the pair did not directly reach the lower boundary of the monthly cloud (1.1184), the strength of the monthly resistance still contributed to a slowdown and the emergence of a downward correction on the daily time frame. As a result, for bulls, the key level for further advancement remains the 1.1184 mark. Conversely, for bears, it is important to continue developing the downward movement, with primary support levels to watch being the supports of the daily Ichimoku golden cross (1.1044 – 1.1023 – 1.0977 – 1.0930).
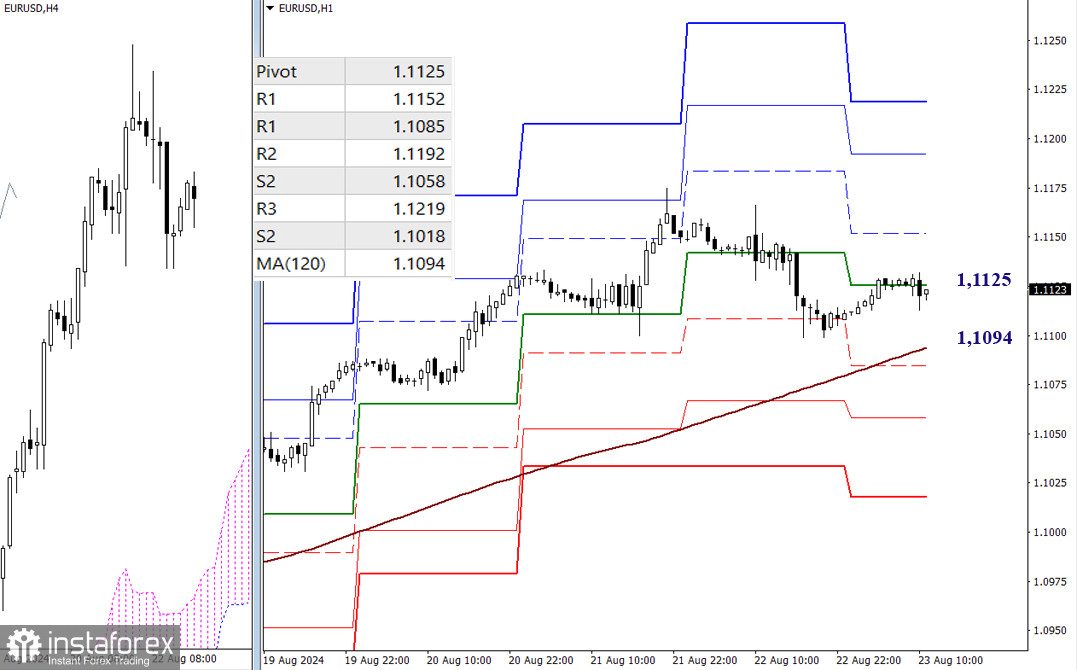
H4 – H1
Bullish traders continue to hold the upper hand in lower time frames. However, a decline is observed, and the pair trades within a corrective zone. Currently, the market is near the central pivot level (1.1125). If the movement turns towards developing bullish sentiment, the intraday resistances of the classic pivot levels (1.1152 – 1.1192 – 1.1219) may come into play. Conversely, if bearish sentiment strengthens, the bears will need to break through the support of the weekly long-term trend (1.1094), after which they will face interactions with the support levels of the classic Pivots (1.1085 – 1.1058 – 1.1018).
***
GBP/USD
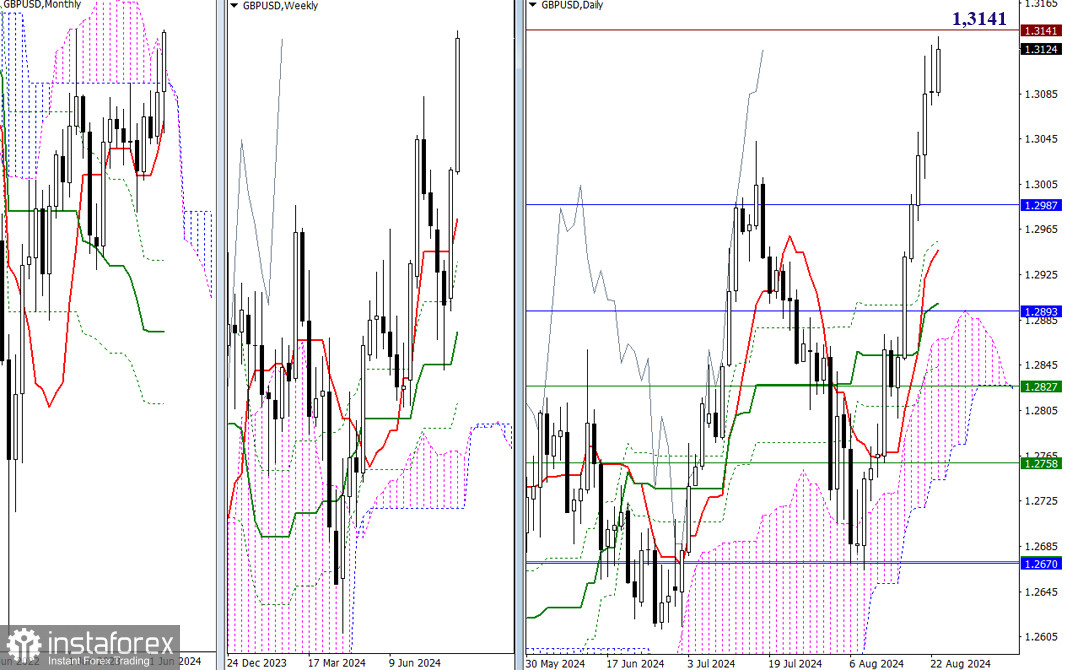
Higher time frames
The pair has again tested the nearest daily high and is close to testing the 2023 high (1.3141). The outcome of this interaction may determine the potential for further developments. A breakout would lead to new opportunities for the bulls. Conversely, a rejection would result in another halt in the development of bullish sentiment and become the basis for the pair to return to the influence zone of the Ichimoku monthly cloud, whose upper boundary is currently at the level of 1.2987.
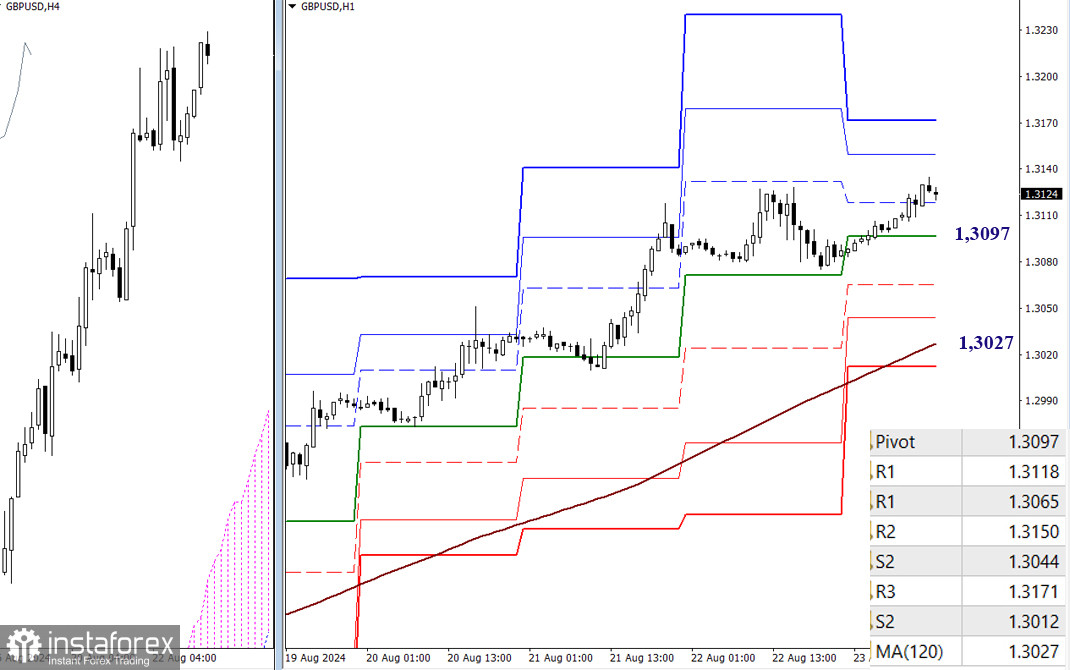
H4 – H1
Bullish traders hold the advantage on lower time frames as well. They are driving the rise, overcoming obstacles in the lower time frames, such as the resistance levels of the classic pivot points (1.3118 – 1.3150 – 1.3171). Key levels in the current situation serve as main reference points in case of a bearish correction. Today, these levels are at 1.3097 (central pivot point of the day) and 1.3027 (weekly long-term trend). The classic pivot point levels (1.3065 – 1.3044) may provide intermediate support levels on the way down to the trend.
***
This technical analysis is based on the following ideas:
Larger time frames - Ichimoku Kinko Hyo (9.26.52) + Fibo Kijun levels
H1 – classic pivot points + 120-period Moving Average (weekly long-term trendline)
*The market analysis posted here is meant to increase your awareness, but not to give instructions to make a trade.
InstaSpot analytical reviews will make you fully aware of market trends! Being an InstaSpot client, you are provided with a large number of free services for efficient trading.


