


Our team has over 7,000,000 traders!
Every day we work together to improve trading. We get high results and move forward.
Recognition by millions of traders all over the world is the best appreciation of our work! You made your choice and we will do everything it takes to meet your expectations!
We are a great team together!
InstaSpot. Proud to work for you!


Actor, UFC 6 tournament champion and a true hero!
The man who made himself. The man that goes our way.
The secret behind Taktarov's success is constant movement towards the goal.
Reveal all the sides of your talent!
Discover, try, fail - but never stop!
InstaSpot. Your success story starts here!

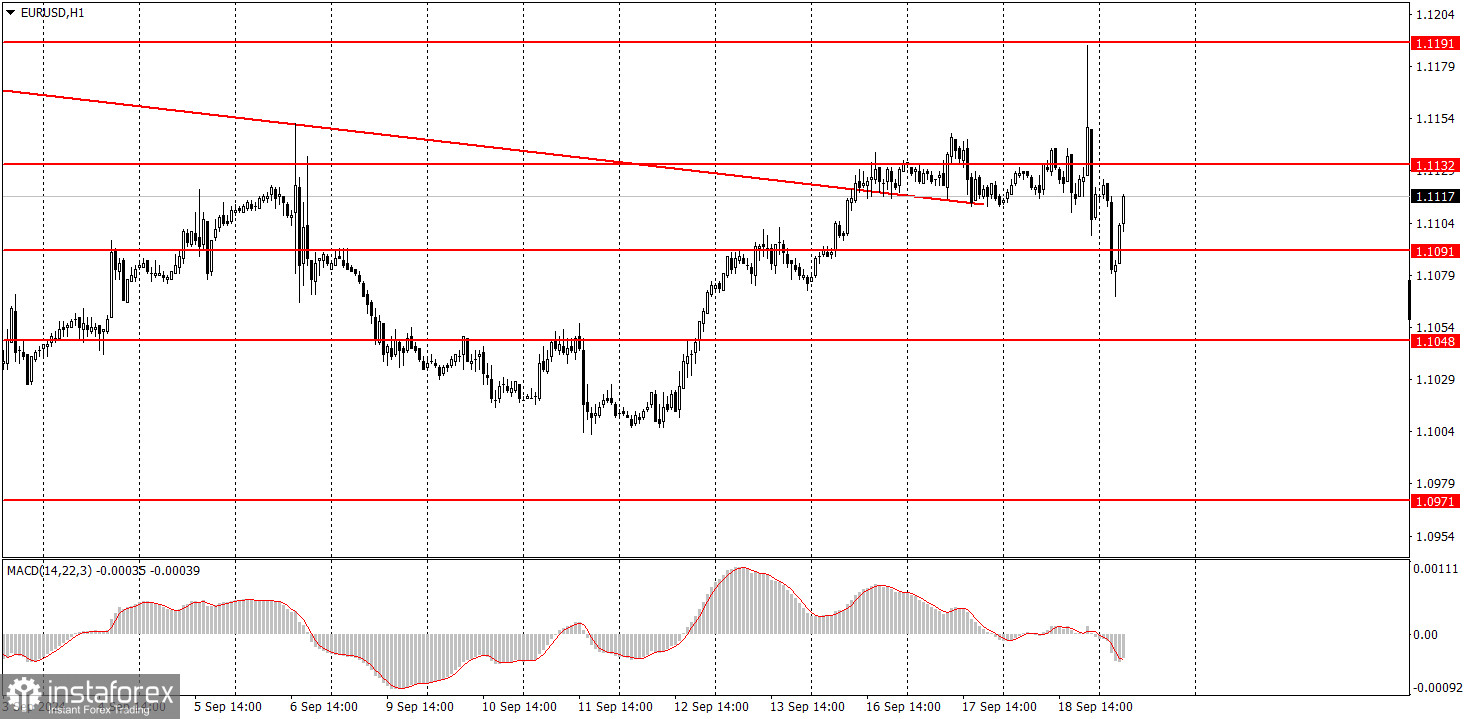
The EUR/USD pair showed growth, a decline, and a rebound (which happened overnight on Thursday). Increased volatility immediately after the announcement of the results from the Federal Reserve meeting is a regular occurrence. Both yesterday and today, we warned traders that it would be wise to conclude the meeting's outcome and the market's reaction by Thursday evening, or at least during the U.S. session. Yesterday, the Fed lowered interest rates by 0.5%. Naturally, we saw a sharp drop in the dollar and a sharp rise in the EUR/USD pair. However, this was followed by an even more significant decline and a subsequent rebound. As a result, the pair is now trading at the same level as the day before the meeting. The key is understanding how the market plans to act going forward. If the U.S. currency does not resume its decline today, our confidence in the idea that the market has already priced in much of the Fed's monetary easing in advance will only strengthen. We didn't see many reasons for the dollar's fall before, and now there are even fewer.
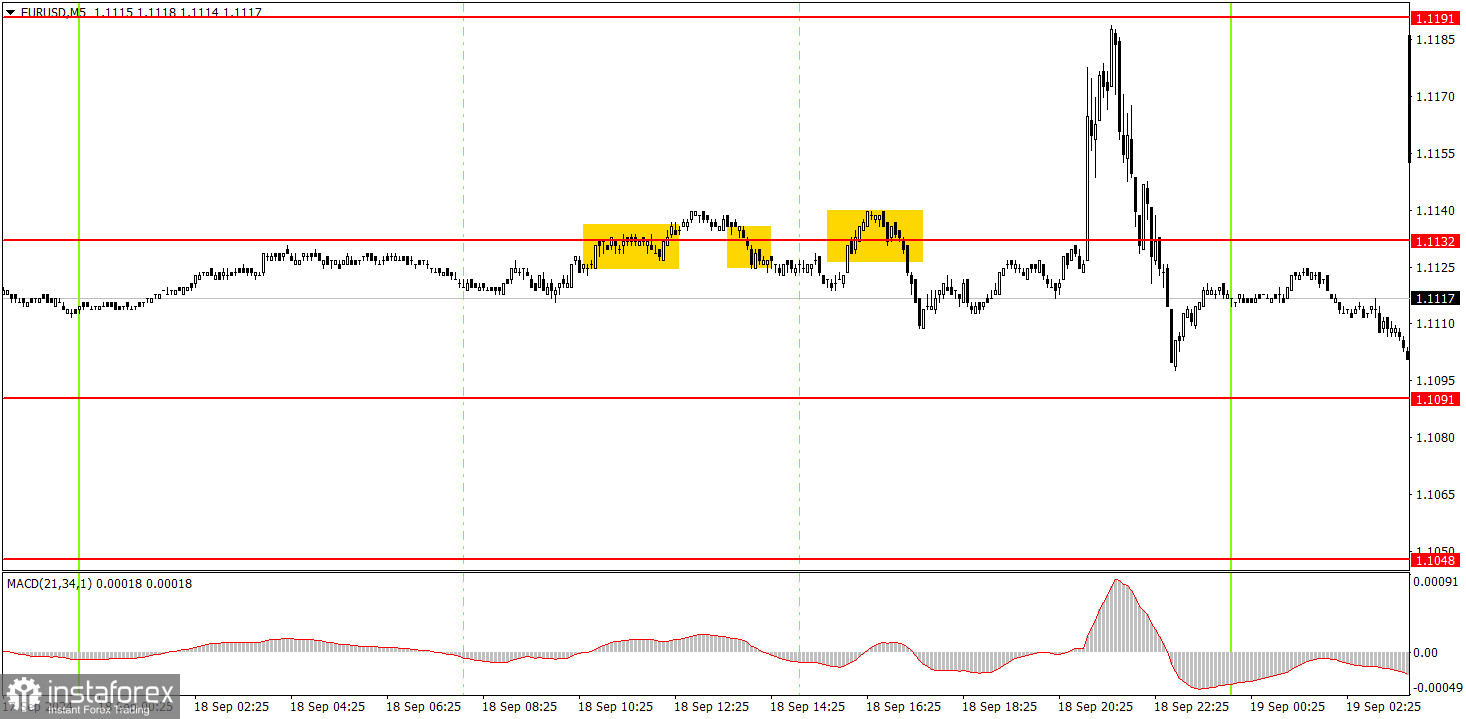
Several trading signals were generated in the 5-minute time frame on Wednesday, but we didn't see a solid reason to enter the market before the Fed meeting. First, it was risky. Second, it was hard to expect good volatility before the announcement. If at least one clear signal had been formed by the evening that was in good profit by the time of the announcement, it would have been possible to move the Stop Loss to break even or close the trade. But there were no solid signals or movements.
In the hourly time frame, the pair still has a chance to form a downward trend, but those chances are quickly fading. Unfortunately, the illogical selling of the dollar may easily resume in the medium term, as no one knows how long the market will continue to price in the Fed's monetary policy easing. The market is still factoring in all future Fed rate cuts while paying no attention to the European Central Bank's easing policies.
On Thursday, the market needs time to settle down and recover from yesterday's Fed meeting. During the day, increased volatility with sharp, non-technical reversals may be observed.
The key levels to consider on the 5M time frame are 1.0726-1.0733, 1.0797-1.0804, 1.0838-1.0856, 1.0888-1.0896, 1.0940, 1.0971, 1.1011, 1.1048, 1.1091, 1.1132, 1.1191, 1.1275-1.1292. No significant events are scheduled in the Eurozone on Thursday, while in the U.S., only a secondary report on jobless claims will be released. However, volatility could still be high today. It's also important to remember the Bank of England's meeting.
1) The strength of a signal is determined by the time it takes for the signal to form (bounce or level breakthrough). The less time it took, the stronger the signal.
2) If two or more trades were opened around any level due to false signals, subsequent signals from that level should be ignored.
3) In a flat market, any currency pair can form multiple false signals or none at all. In any case, it's better to stop trading at the first signs of a flat market.
4) Trades should be opened between the start of the European session and midway through the U.S. session. After this period, all trades must be closed manually.
5) In the hourly time frame, trades based on MACD signals are only advisable amidst good volatility and a trend confirmed by a trendline or trend channel.
6) If two levels are too close to each other (5 to 20 pips), they should be considered a support or resistance area.
7) After moving 15 pips in the intended direction, the Stop Loss should be set to break even.
Support and Resistance price levels: targets for opening long or short positions. You can place Take Profit levels around them.
Red lines: channels or trend lines that depict the current trend and indicate the preferred trading direction.
The MACD indicator (14,22,3): encompassing both the histogram and signal line, acts as an auxiliary tool and can also be used as a source of signals.
Important speeches and reports (always noted in the news calendar) can profoundly influence the movement of a currency pair. Hence, trading during their release calls for heightened caution. It may be reasonable to exit the market to avoid sharp price reversals against the prevailing movement.
For beginners, it's important to remember that not every trade will yield profit. Developing a clear strategy and effective money management is key to success in trading over the long term.
*The market analysis posted here is meant to increase your awareness, but not to give instructions to make a trade.
InstaSpot analytical reviews will make you fully aware of market trends! Being an InstaSpot client, you are provided with a large number of free services for efficient trading.


