


Our team has over 7,000,000 traders!
Every day we work together to improve trading. We get high results and move forward.
Recognition by millions of traders all over the world is the best appreciation of our work! You made your choice and we will do everything it takes to meet your expectations!
We are a great team together!
InstaSpot. Proud to work for you!


Actor, UFC 6 tournament champion and a true hero!
The man who made himself. The man that goes our way.
The secret behind Taktarov's success is constant movement towards the goal.
Reveal all the sides of your talent!
Discover, try, fail - but never stop!
InstaSpot. Your success story starts here!

The EUR/USD currency pair cooled down a bit on Wednesday after two days of decline, but overall, it hasn't even started a bullish correction. And that's a very good sign. We've repeatedly mentioned that the euro is overbought and the dollar is oversold, so a decline in the EUR/USD pair would have seemed logical under any macroeconomic and fundamental circumstances, even without them. However, this week, the dollar received support from Jerome Powell and Christine Lagarde and macroeconomic data for the first time in a while. Yesterday, the only somewhat important report, ADP (the equivalent of NonFarm Payrolls), came in stronger than expected, which allowed the dollar to appreciate a bit more. It's important to note that the ADP report has no correlation with NonFarms. In other words, it doesn't indicate that NonFarms will show strong figures on Friday. However, everything this week seems to be working in favor of the dollar.
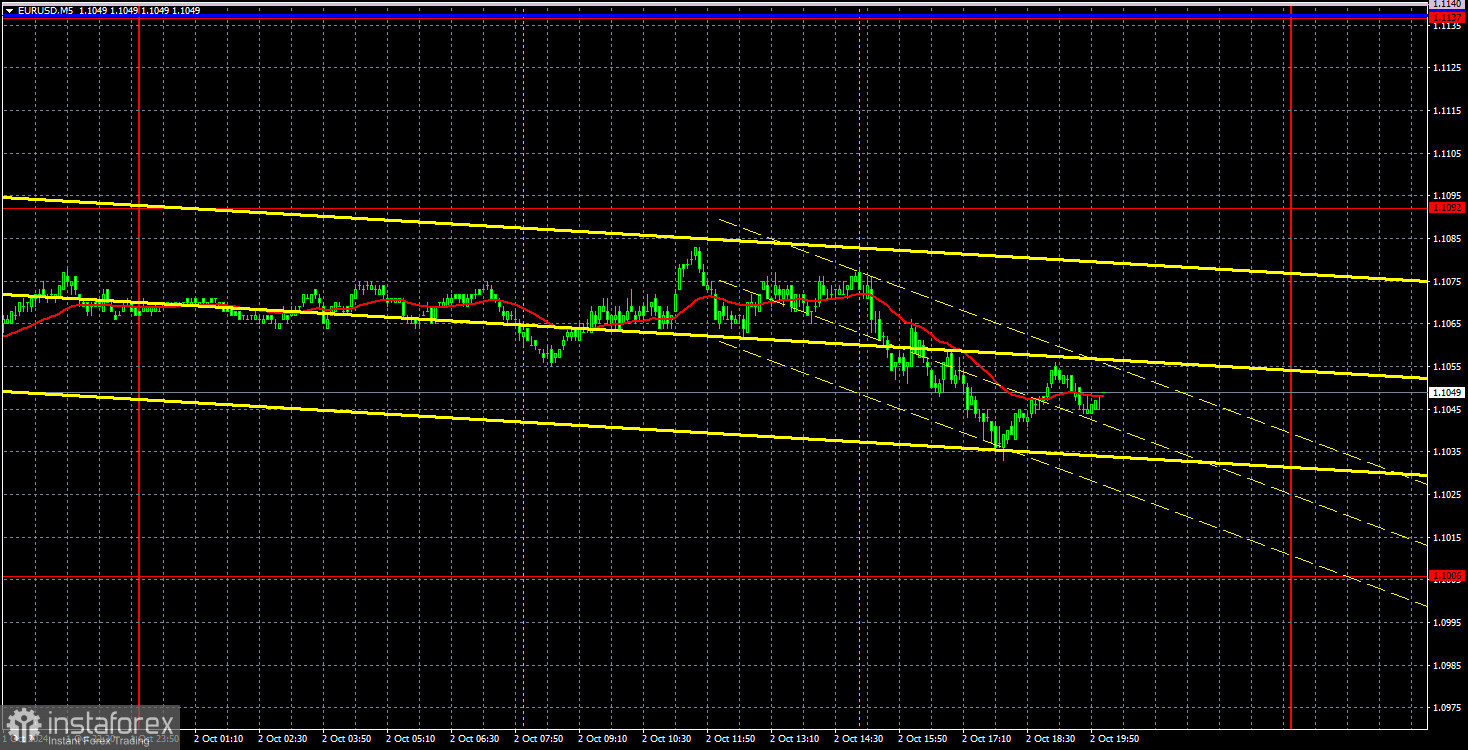
From a technical standpoint, things are straightforward as well. The price left the ascending, semi-horizontal channel and consolidated below both lines of the Ichimoku indicator. Thus, the short-term trend is downward, and there is no doubt about it. Therefore, we expect further strengthening of the U.S. dollar.
Yesterday, no trade signals were formed in the 5-minute time frame. The price approached the 1.1092 level once but couldn't be tested accurately enough, so no entry signals were generated.
Overall, the dollar's fate depends on Friday's reports. If they don't disappoint, the situation will be such that the market has already priced in all the most dovish scenarios regarding the Federal Reserve's monetary policy. Hence, there will be no more reasons for the dollar to fall.
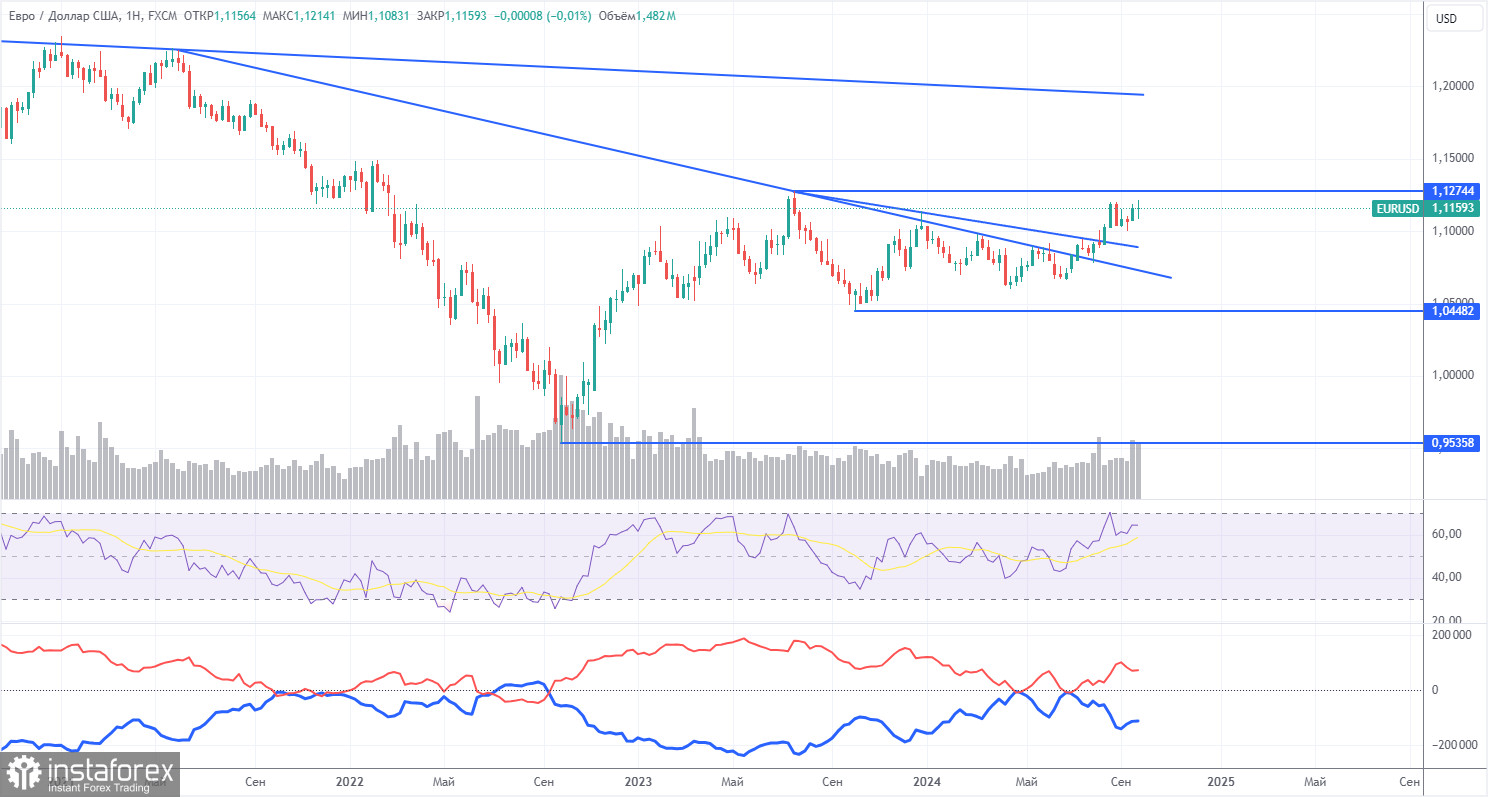
The latest COT (Commitment of Traders) report is dated September 24. The illustration above clearly shows that the net position of non-commercial traders has remained bullish for a long time. The bears' attempt to gain dominance was a resounding failure. The net position of non-commercial traders (red line) declined in the second half of 2023 and the first half of 2024, while commercial traders (blue line) increased. Currently, professional traders are once again building up long positions.
We still do not see any fundamental factors for strengthening the euro, and technical analysis suggests that the price is in a consolidation zone – in simpler terms, a flat market. On the weekly time frame, it's visible that since December 2022, the pair has been trading between 1.0448 and 1.1274. In other words, we have moved from a 7-month flat market to an 18-month one.
The red and blue lines are diverging at the moment, indicating an increase in long positions for the euro. However, such changes cannot be the basis for long-term conclusions within the flat market. During the last reporting week, the number of longs in the non-commercial group increased by 5,500, while the number of shorts grew by 3,500. Consequently, the net position increased by 2,000. The potential for a decline in the euro currency remains.
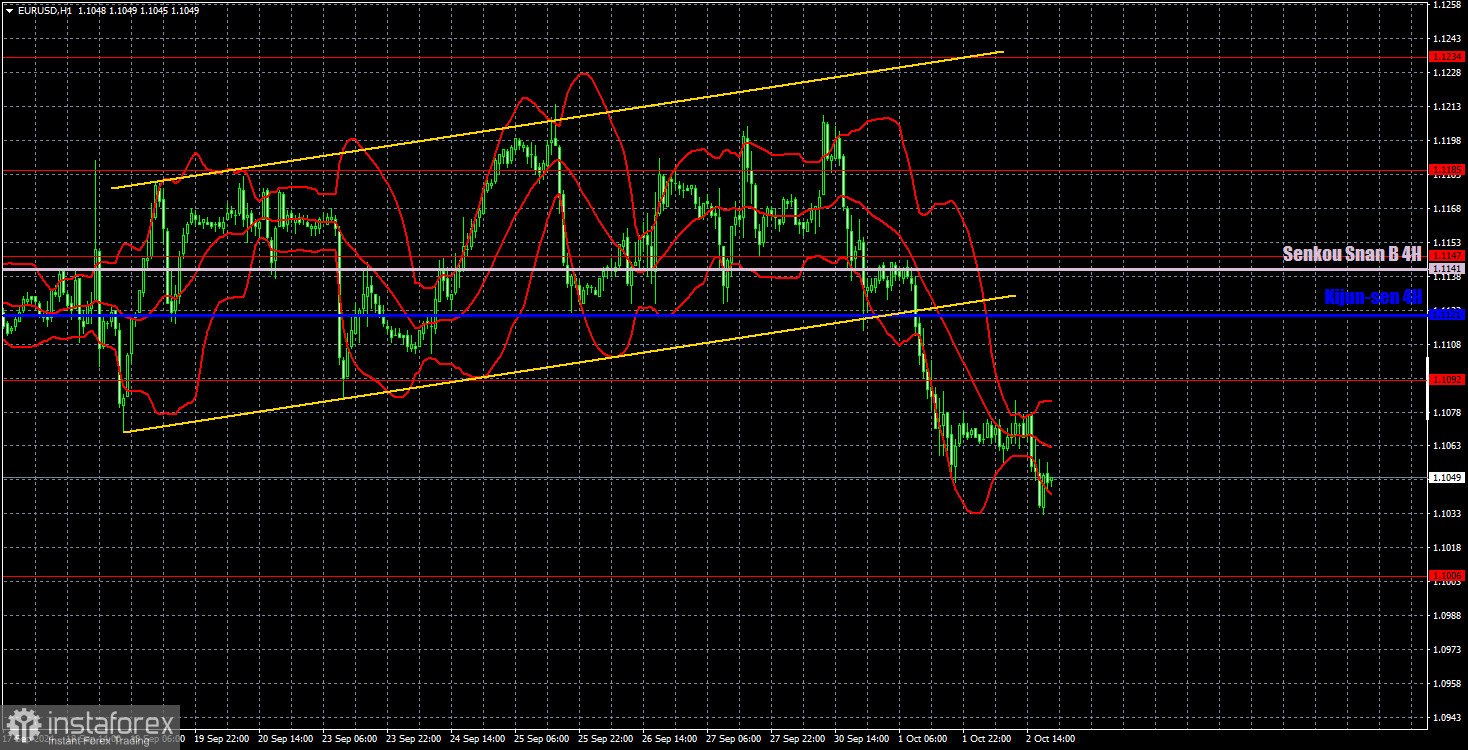
In the hourly time frame, the pair still has a real chance to end the two-year unjustified uptrend. There's no point in discussing fundamental and macroeconomic reasons for further dollar decline—they don't exist. Technical analysis has also turned in favor of a downward movement. Of course, the two-year uptrend may continue for some time due to momentum, but we expect nothing but a decline in the medium term.
For October 3, we highlight the following trading levels: 1.0658-1.0669, 1.0757, 1.0797, 1.0843, 1.0889, 1.0935, 1.1006, 1.1092, 1.1147, 1.1185, 1.1234, 1.1274, as well as the Senkou Span B line (1.1141) and Kijun-sen line (1.1121). The Ichimoku indicator lines can move throughout the day, so this should be considered when determining trading signals. Don't forget to set a Stop Loss at break even if the price moves 15 pips in the intended direction. This will protect you from possible losses if the signal is false.
On Thursday, service sector PMI indices for the Eurozone, Germany, and the U.S. will be released in their second estimates for September. These are secondary data. The day's main event will be the ISM Services PMI in the U.S., which could trigger either a rise or a fall in the dollar.
Support and resistance levels: thick red lines where price movement may end. They are not sources of trading signals.
Kijun-sen and Senkou Span B lines: lines of the Ichimoku indicator transferred to the hourly time frame from the 4-hour chart. These are strong lines.
Extreme levels: thin red lines from which the price has previously bounced. They serve as sources of trading signals.
Yellow lines: trend lines, trend channels, and other technical patterns.
Indicator 1 on the COT charts: shows the net position size of each trader category.
*The market analysis posted here is meant to increase your awareness, but not to give instructions to make a trade.
InstaSpot analytical reviews will make you fully aware of market trends! Being an InstaSpot client, you are provided with a large number of free services for efficient trading.


