


Our team has over 7,000,000 traders!
Every day we work together to improve trading. We get high results and move forward.
Recognition by millions of traders all over the world is the best appreciation of our work! You made your choice and we will do everything it takes to meet your expectations!
We are a great team together!
InstaSpot. Proud to work for you!


Actor, UFC 6 tournament champion and a true hero!
The man who made himself. The man that goes our way.
The secret behind Taktarov's success is constant movement towards the goal.
Reveal all the sides of your talent!
Discover, try, fail - but never stop!
InstaSpot. Your success story starts here!

The GBP/USD currency pair continued trading with a slight decline on Wednesday. This does not surprise us, as the British pound is even more overbought and unjustifiably expensive than the euro. In 2024, the euro has at least undergone occasional corrections, but it seems the pound hasn't had this option. Therefore, the decline we observed in the first three weeks is just the bare minimum that could happen. We believe that the fall of the British currency and the rise of the U.S. dollar should continue in the medium term in almost any scenario.
Yesterday, the only report worth noting was the ADP report on the change in non-farm payrolls, which helped the dollar gain a bit more during the U.S. session. Additionally, it's worth mentioning that earlier this week, the UK's GDP report for the second quarter came out worse than expected. Therefore, the currency pair has plenty of reasons to continue declining. However, the market is not rushing to sell and is waiting for the Non-Farm Payrolls and unemployment reports. Unfortunately for the dollar, these two reports could potentially negate all its progress this week.
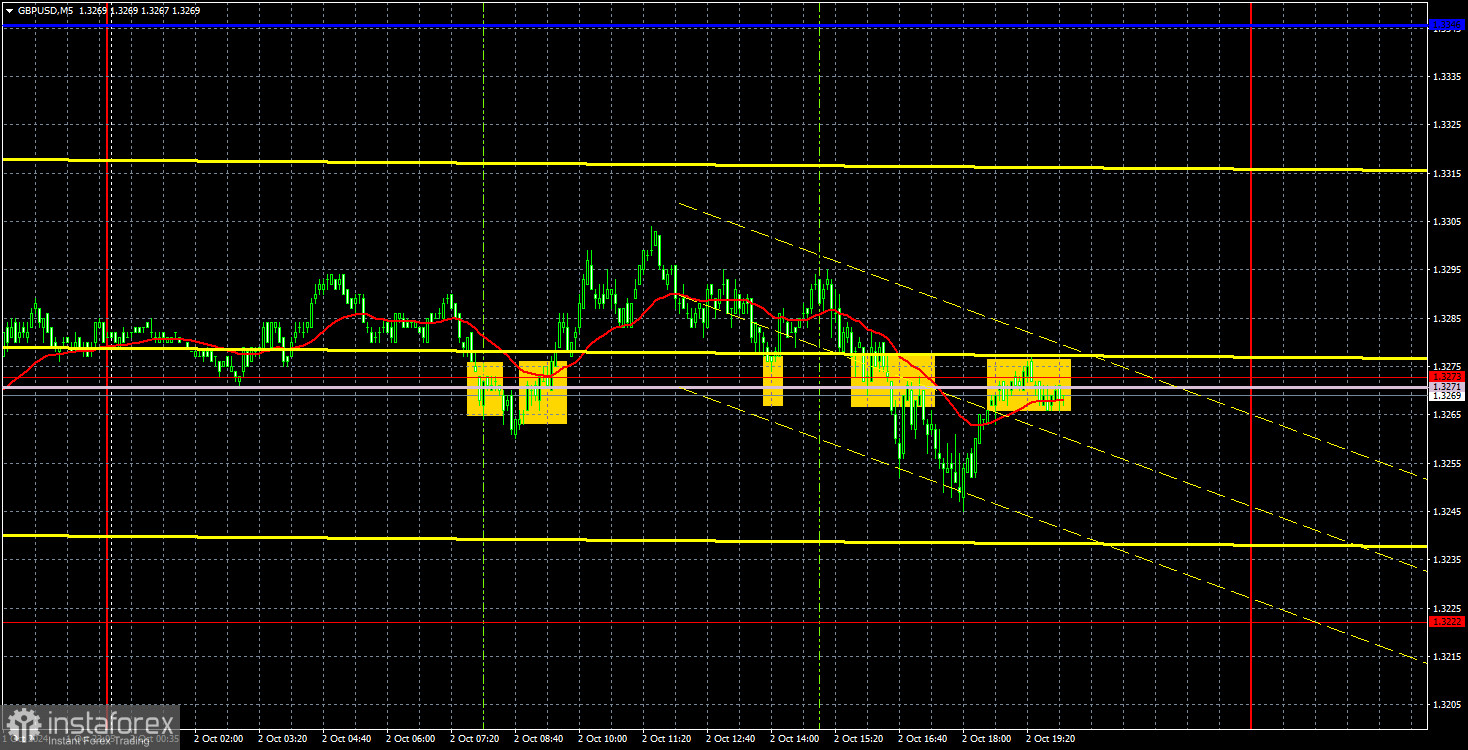
Many trading signals were formed on Wednesday, but all of them were false. The price repeatedly either broke through the Senkou Span B line or bounced off it and eventually settled below. Thus, traders could only work with the first two signals. The sell trade closed with a small loss, while the buy trade could have been closed with a small profit.
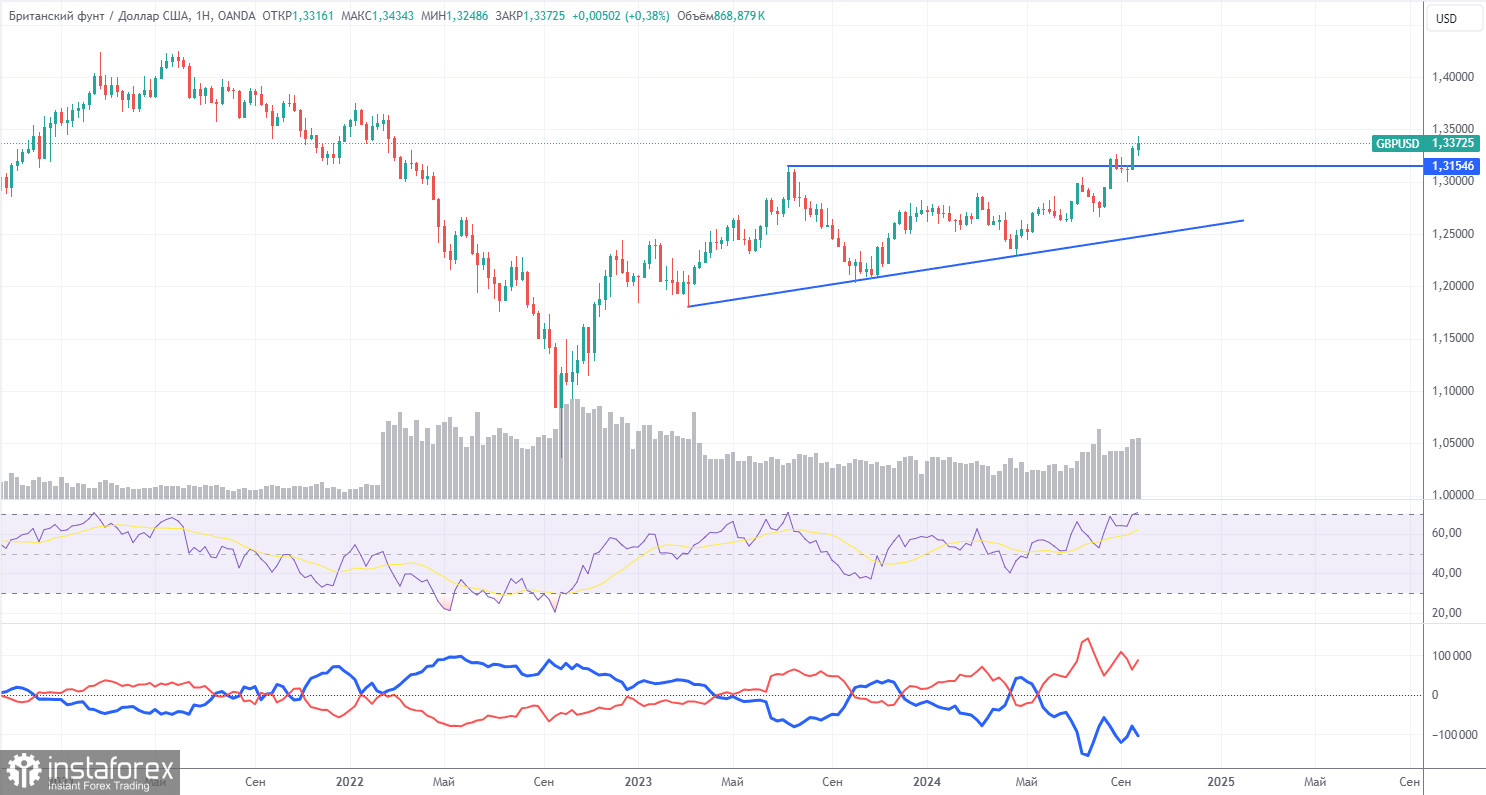
The COT reports for the British pound show that commercial traders' sentiment has been constantly changing over recent years. The red and blue lines, representing the net positions of commercial and non-commercial traders, frequently intersect and are mainly near the zero mark. We also see that the last phase of the downtrend occurred when the red line was below the zero mark. The red line is above zero, and the price has broken through the important level of 1.3154.
According to the latest report on the British pound, the non-commercial group opened 30,500 BUY contracts and 6,500 SELL contracts. Thus, the net position of non-commercial traders increased by 24,000 contracts over the week. Market participants continue to buy up the pound sterling.
The fundamental backdrop still provides no basis for long-term purchases of the pound sterling, and the currency itself has a genuine chance of resuming a global downtrend. However, on the weekly time frame, an ascending trendline has formed, so until it is broken, we cannot expect the pound to fall in the long term. The pound sterling is rising against almost all odds, and even when COT reports show that major players are selling the pound, it continues to grow. The CCI indicator has already entered the overbought area, even on the weekly time frame.
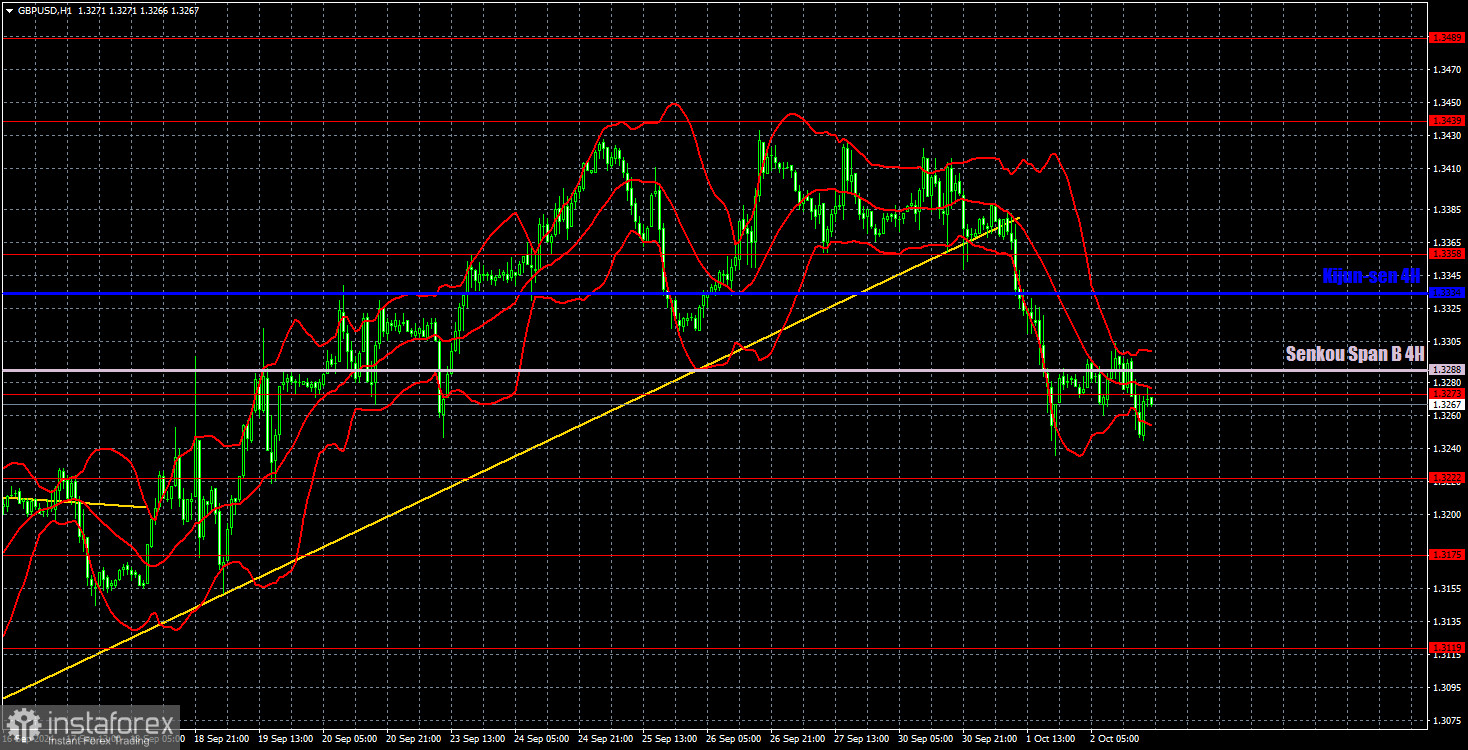
In the hourly time frame, the GBP/USD pair has started to decline. The upward trend has been canceled, and we can expect only a solid and prolonged fall in the British currency. Of course, the market may resume unjustified purchases of the British pound, but let's reiterate—there are no fundamental or macroeconomic reasons for this. Therefore, as before, we favor the GBP/USD pair falling.
For October 3, we highlight the following important levels: 1.2796-1.2816, 1.2863, 1.2981-1.2987, 1.3050, 1.3119, 1.3175, 1.3222, 1.3273, 1.3367, 1.3439. The Senkou Span B line (1.3288) and the Kijun-sen line (1.3334) can also serve as signal sources. Setting the Stop Loss to break even when the price moves 20 pips in the intended direction is recommended. The Ichimoku indicator lines may shift during the day, which should be considered when determining trade signals.
For Thursday, service sector business activity indexes for September's second estimates are scheduled for release in the UK and the U.S., but these are secondary data. The market's primary focus will be on the ISM index for the U.S. services sector, which will be published in the second half of the day.
Support and resistance levels: thick red lines where price movement may end. They are not sources of trading signals.
Kijun-sen and Senkou Span B lines: lines of the Ichimoku indicator transferred to the hourly time frame from the 4-hour chart. These are strong lines.
Extreme levels: thin red lines from which the price has previously bounced. They serve as sources of trading signals.
Yellow lines: trend lines, trend channels, and other technical patterns.
Indicator 1 on the COT charts: shows the net position size of each trader category.
*The market analysis posted here is meant to increase your awareness, but not to give instructions to make a trade.
InstaSpot analytical reviews will make you fully aware of market trends! Being an InstaSpot client, you are provided with a large number of free services for efficient trading.


