


Our team has over 7,000,000 traders!
Every day we work together to improve trading. We get high results and move forward.
Recognition by millions of traders all over the world is the best appreciation of our work! You made your choice and we will do everything it takes to meet your expectations!
We are a great team together!
InstaSpot. Proud to work for you!


Actor, UFC 6 tournament champion and a true hero!
The man who made himself. The man that goes our way.
The secret behind Taktarov's success is constant movement towards the goal.
Reveal all the sides of your talent!
Discover, try, fail - but never stop!
InstaSpot. Your success story starts here!

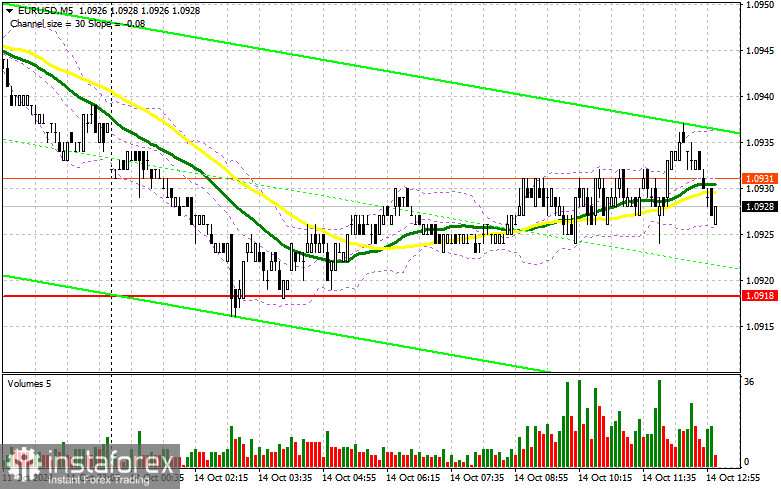
In my morning forecast, I focused on the 1.0918 level and planned to make market entry decisions based on it. Let's look at the 5-minute chart to analyze what happened. The pair's decline occurred, but it didn't reach the 1.0918 level, so I didn't find any suitable entry points in the first half of the day. The technical picture for the second half of the day remains unchanged.
For Opening Long Positions on EUR/USD:
The absence of significant data impacted the euro, as expected. Low volatility may continue into the second half of the day, as the calendar only includes a few FOMC member speeches. It is likely that their statements will not have much impact after last week's series of speeches from Fed officials. I expect trading to remain within the sideways channel. If the pair declines, a false breakout near the 1.0918 support level could provide a good opportunity to increase long positions, opening the way toward 1.0952, a level the pair has struggled to break above. A breakout and retest of this range would confirm a solid entry point for buying, with a target of reaching 1.0979. The final target will be the 1.1011 high, where I will take profit. If EUR/USD continues to decline and shows no activity near 1.0918 in the second half of the day, pressure on the euro will persist. In that case, I'll enter only after a false breakout near the next support level at 1.0884. I plan to open long positions from 1.0855 on a rebound, aiming for an upward correction of 30-35 points within the day.
For Opening Short Positions on EUR/USD:
Sellers haven't disappeared but are in no hurry to act. If FOMC members make very soft statements, the euro may see a temporary rise. In this case, a false breakout near 1.0952 would offer a good entry point for new short positions with a potential decline toward the 1.0918 support. A breakout and consolidation below this range, followed by a retest from the bottom-up, would be another suitable scenario for selling, with a move toward 1.0884, strengthening the bearish market. Only there do I expect to see more active bulls. The final target will be around 1.0855, where I will take profit. If EUR/USD moves upward in the second half of the day and there is no bearish activity near 1.0952, buyers will have a chance for a slight strengthening of the pair at the start of the week. In that case, I will postpone selling until the next resistance test at 1.0979. I will also sell there, but only after an unsuccessful attempt at consolidation. I plan to open short positions on a rebound from 1.1011, aiming for a downward correction of 30-35 points.
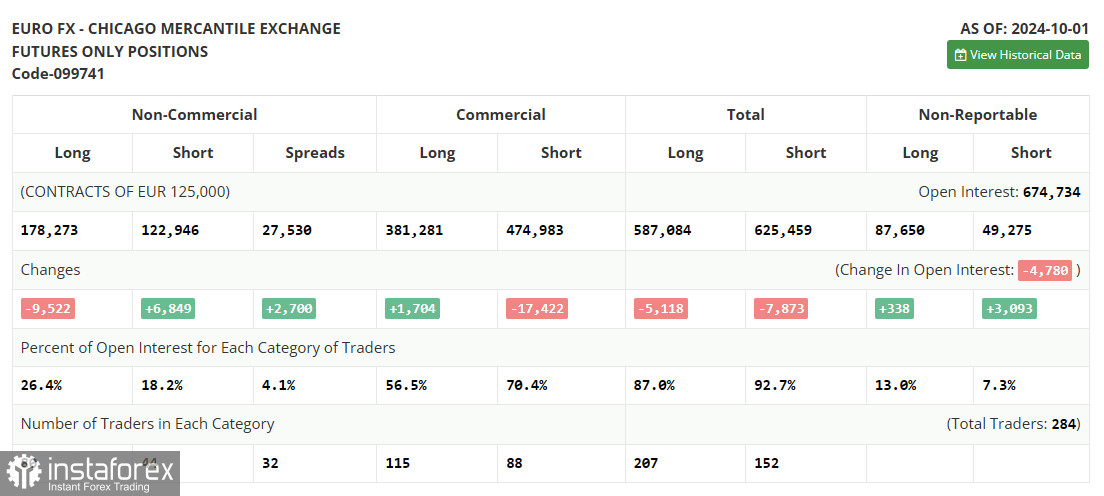
The COT report (Commitment of Traders) for October 1 showed a slight increase in short positions and a sharp reduction in long positions, leading to a shift in market balance toward sellers. The recent U.S. labor market data, which outperformed economists' expectations, is now a key factor for future Federal Reserve decisions, which are likely to be less sharp and unexpected. The central bank will likely take a more cautious stance on rate cuts, positively impacting the strength of the U.S. dollar. However, this doesn't negate the medium-term upward trend for the pair, and the lower the pair goes, the more attractive it becomes for buying. The COT report indicated that long non-commercial positions decreased by 9,522 to 178,273, while short non-commercial positions grew by 6,849 to 122,946. As a result, the gap between long and short positions increased by 2,700.
Indicator Signals:
Moving Averages:
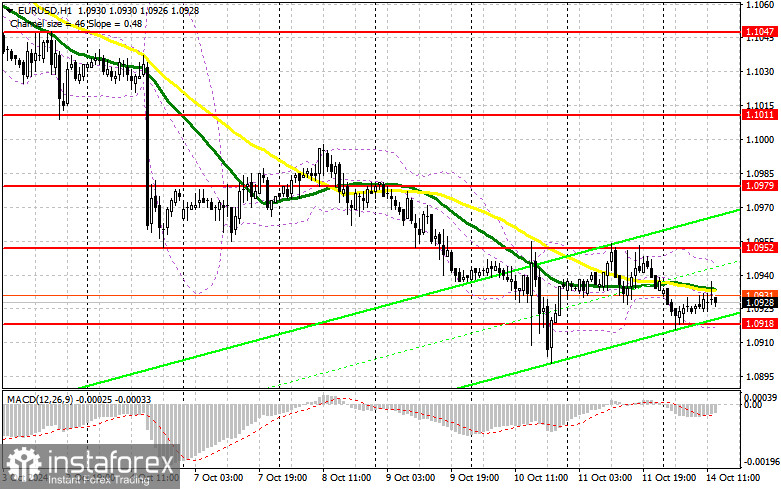
The pair is trading around the 30 and 50-day moving averages, indicating market uncertainty. Note: The moving averages discussed here are based on the hourly H1 chart and differ from the daily moving averages typically used on the D1 chart.
Bollinger Bands:
If the pair declines, the lower boundary of the Bollinger Bands near 1.0918 will act as support.
Indicator Descriptions:
*The market analysis posted here is meant to increase your awareness, but not to give instructions to make a trade.
InstaSpot analytical reviews will make you fully aware of market trends! Being an InstaSpot client, you are provided with a large number of free services for efficient trading.


