


Our team has over 7,000,000 traders!
Every day we work together to improve trading. We get high results and move forward.
Recognition by millions of traders all over the world is the best appreciation of our work! You made your choice and we will do everything it takes to meet your expectations!
We are a great team together!
InstaSpot. Proud to work for you!


Actor, UFC 6 tournament champion and a true hero!
The man who made himself. The man that goes our way.
The secret behind Taktarov's success is constant movement towards the goal.
Reveal all the sides of your talent!
Discover, try, fail - but never stop!
InstaSpot. Your success story starts here!

In my morning forecast, I highlighted the level of 1.2961 and planned to make market entry decisions based on it. Let's take a look at the 5-minute chart to review what happened. The breakout and retest of 1.2961 offered a strong entry point for buying the pound, resulting in a 20-point increase in the pair by the time this forecast was written. The technical picture has been slightly revised for the second half of the day.
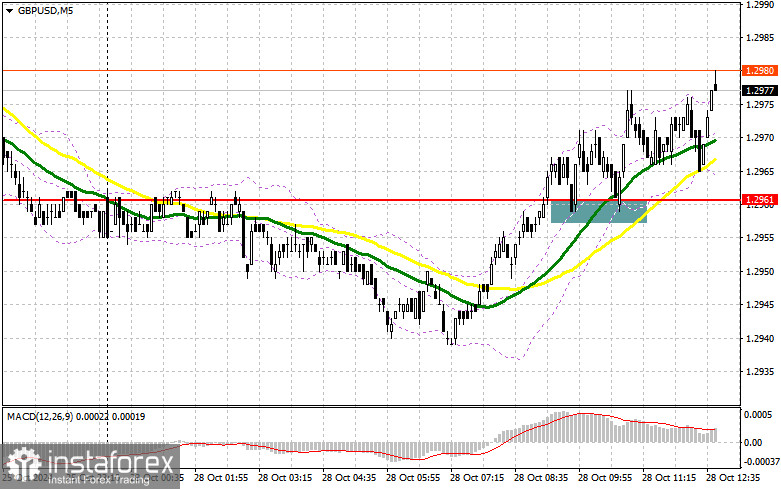
To Open Long Positions on GBP/USD:
With no major U.S. statistics in the second half of the day, buyers have a chance to reach the nearest resistance at 1.2991. It's also essential to monitor the support level of 1.2961, which worked well in the morning. If the pair declines, a false breakout at this level, as discussed earlier, will confirm a valid long entry point, targeting 1.2991, which was not reached in the first half of the day. A breakout and retest of 1.2991 will present a new entry point for long positions, with the potential to reach 1.3011. The final target is around 1.3030, where I plan to take profits. Should GBP/USD decline with no bullish activity at 1.2961 in the second half of the day, the bear market will likely return, pushing the pair toward the next support at 1.2940. Only a false breakout here will provide a suitable condition to open long positions. I'll consider buying GBP/USD on a rebound from the 1.2924 low, aiming for a 30-35 point intraday correction.
To Open Short Positions on GBP/USD:
Sellers made little effort to defend 1.2961, which raises some questions. Now, it's crucial not to miss the nearby resistance at 1.2991, which could be tested soon. Only a false breakout at this level will provide a suitable selling opportunity, keeping the pair within the sideways channel and targeting the support at 1.2961. A breakout and retest of this range from below will strike a blow to buyers' positions, potentially triggering stop orders and opening the way to 1.2940. The final target is the 1.2924 level, where I plan to take profits. Testing this level will reinforce the bear market. If GBP/USD rises and no bearish activity appears at 1.2991—which is likely under the current conditions—buyers may continue pushing higher. In this case, bears will have to retreat to the resistance at 1.3011. I'll only sell there on a false breakout. If there's no downward movement, I'll look for short positions on a rebound around 1.3030, aiming for a 30-35 point downward correction.
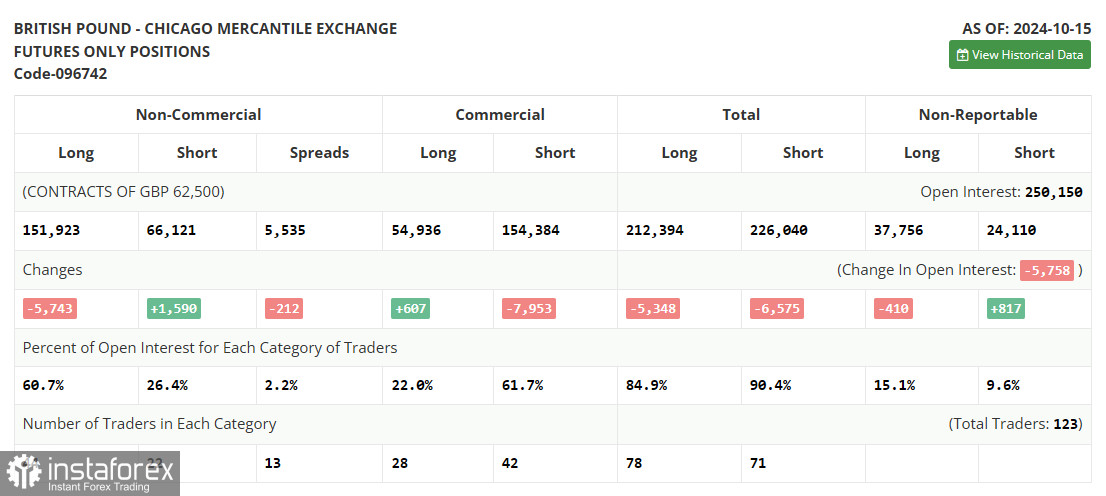
The October 15 COT report showed a decrease in long positions and an increase in short positions, though this hasn't significantly impacted the buyer-to-seller ratio, which remains approximately 2.5 to 1. UK labor market and inflation data have negatively affected the pound's upward potential, as they suggest further rate cuts in the UK, which is unfavorable for the currency. With limited significant statistics this week, market attention will focus on statements from Bank of England representatives that may provide guidance on future policy. The latest COT report indicates that long non-commercial positions decreased by 5,743 to 151,923, while short non-commercial positions increased by 1,590 to 66,121, narrowing the net gap between long and short positions by 212.
Indicator Signals:
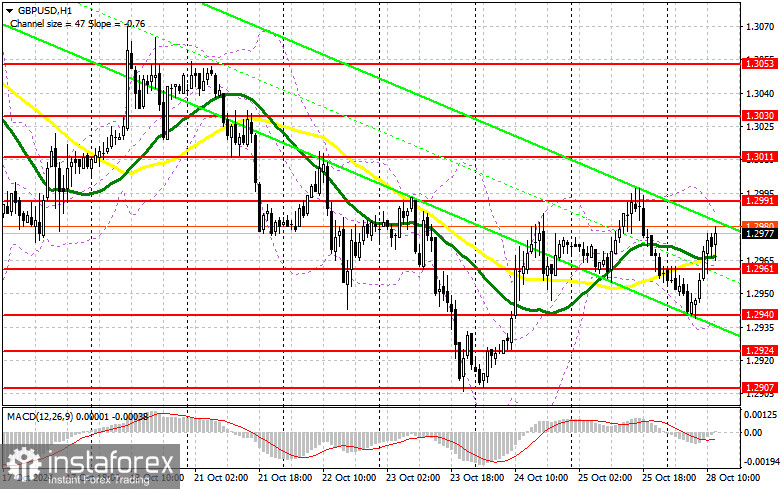
Moving Averages
Trading is occurring around the 30 and 50-day moving averages, indicating a sideways market.
Note: The period and moving average prices are considered on the hourly H1 chart and differ from the conventional daily moving averages on the D1 daily chart.
Bollinger Bands
In the case of a decline, the lower boundary of the indicator, near 1.2940, will act as support.
Indicator Descriptions:
*The market analysis posted here is meant to increase your awareness, but not to give instructions to make a trade.
InstaSpot analytical reviews will make you fully aware of market trends! Being an InstaSpot client, you are provided with a large number of free services for efficient trading.


