


Our team has over 7,000,000 traders!
Every day we work together to improve trading. We get high results and move forward.
Recognition by millions of traders all over the world is the best appreciation of our work! You made your choice and we will do everything it takes to meet your expectations!
We are a great team together!
InstaSpot. Proud to work for you!


Actor, UFC 6 tournament champion and a true hero!
The man who made himself. The man that goes our way.
The secret behind Taktarov's success is constant movement towards the goal.
Reveal all the sides of your talent!
Discover, try, fail - but never stop!
InstaSpot. Your success story starts here!

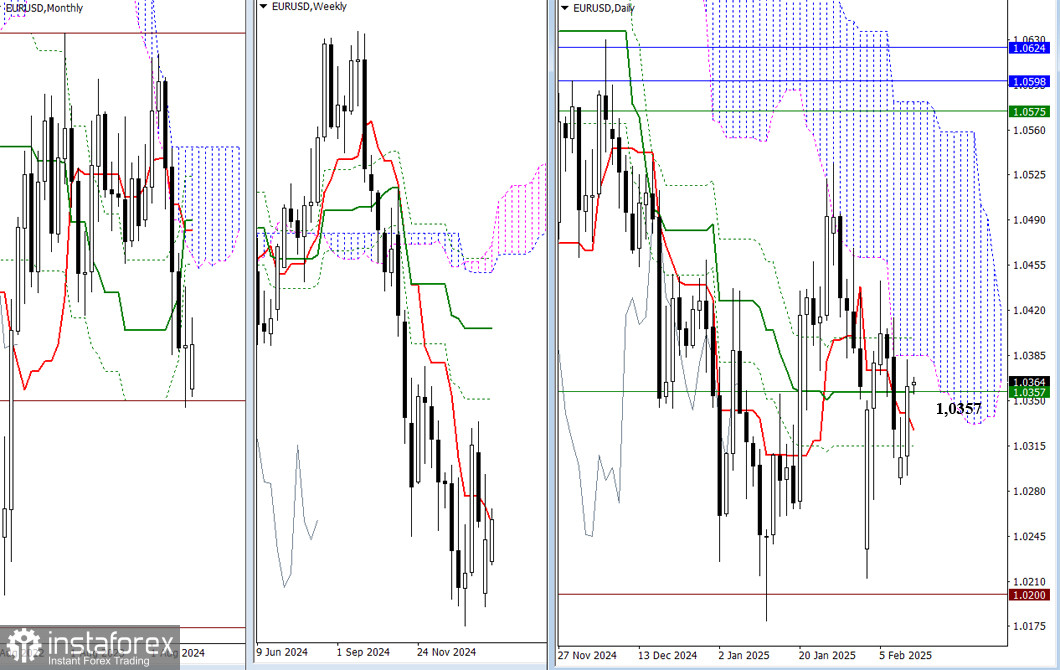
Another downward gap has been closed, and the pair has returned to the weekly short-term trend level (1.0357). In addition to the weekly Tenkan, the daily Ichimoku influences this chart section. Most of its key levels are now clustered in the support zone (1.0328 – 1.0315) and resistance zone (1.0385 – 1.0398), with the center marked at 1.0357 (the daily medium-term trend + weekly short-term trend). A clear breakout beyond this range will open new movement prospects. If bullish players gain control, their focus will shift toward the resistance cluster in the 1.0575 – 1.0624 range, where multiple timeframe levels are concentrated. Conversely, if bears push the price below 1.0328 – 1.0315, they will again target the historical support at 1.0200 and restore the downward trend at 1.0179.
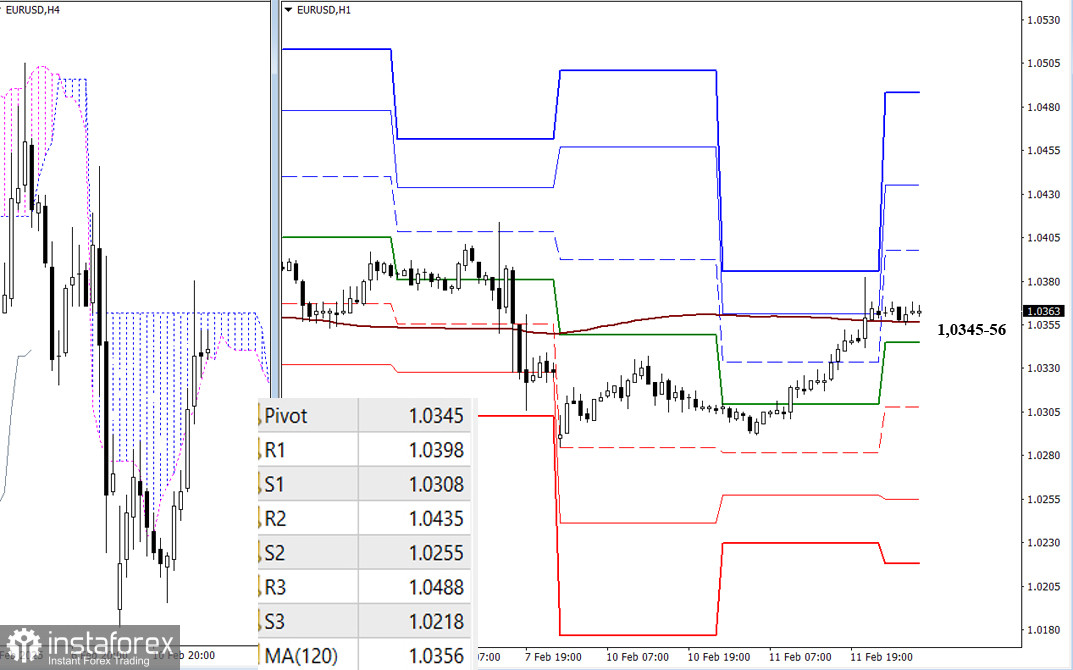
On lower timeframes, bullish traders have successfully consolidated above the key levels of 1.0345 – 1.0356 (central Pivot level + weekly long-term trend). If they hold their ground, they may further strengthen their position, continuing the upward movement. The intraday upside targets are the resistances of the classic Pivot levels (1.0398 – 1.0435 – 1.0488). However, if the key levels are lost and bears regain control, they will strengthen their position by breaching the support levels of the classic Pivot points (1.0308 – 1.0255 – 1.0218).
***
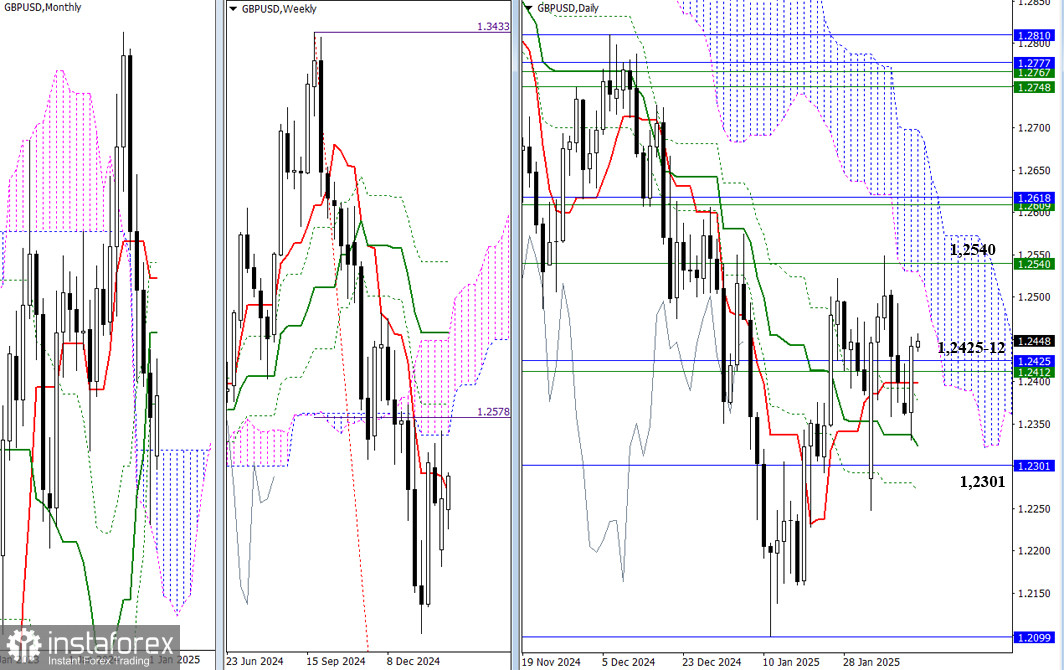
Since the end of January, the currency pair has been fluctuating between the lower boundary of the weekly Ichimoku cloud at 1.2540 and the upper boundary of the monthly cloud at 1.2301. The area that combines the monthly level of 1.2425 and the weekly level of 1.2412 is currently attracting attention. A confirmed breakout beyond these boundaries could change the market dynamics, potentially leading to a sustained directional movement. Additionally, the levels of the daily Ichimoku cross (1.2399, 1.2377, 1.2324, and 1.2271) are acting as further support levels.
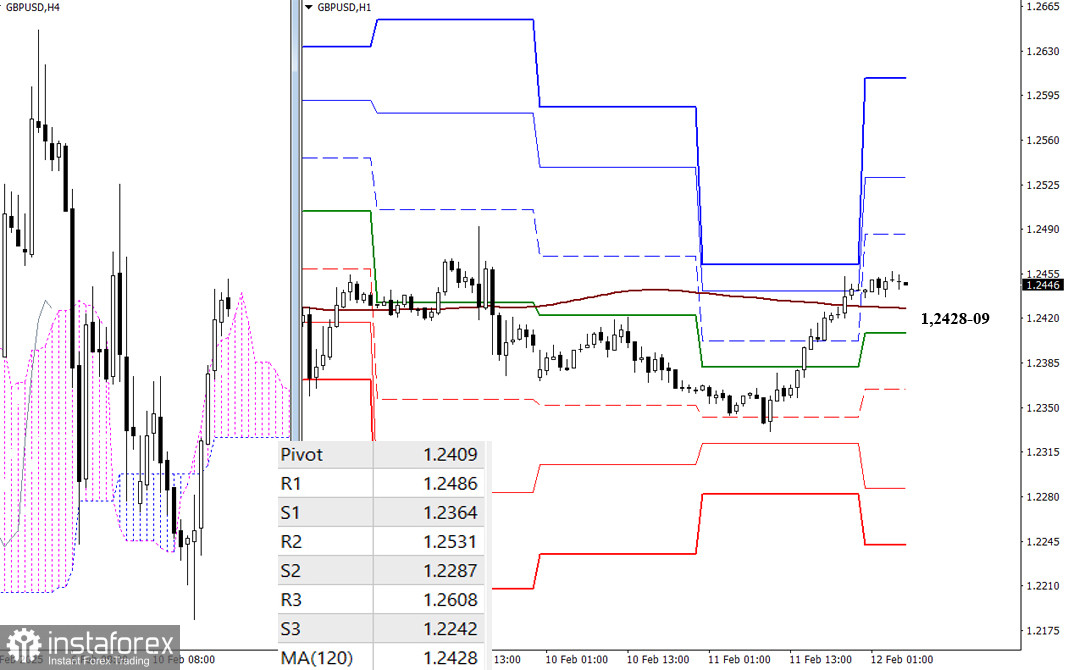
On lower timeframes, bullish traders have managed to break above key levels and consolidate, giving them a dominant position in the market. If they can hold their gains and continue the upward trend, the intraday upside targets will be the classic Pivot resistances (1.2486 – 1.2531 – 1.2608). However, if the bears regain momentum and reclaim the key levels of 1.2428 – 1.2409 (the central Pivot level of the day + the weekly long-term trend), then the market's intraday focus will shift toward the support levels of the classic Pivot points (1.2364 – 1.2287 – 1.2242).
***
*The market analysis posted here is meant to increase your awareness, but not to give instructions to make a trade.
InstaSpot analytical reviews will make you fully aware of market trends! Being an InstaSpot client, you are provided with a large number of free services for efficient trading.


