


La légende dans l'équipe InstaSpot!
La vraie légende! Vous pensez que c'est trop pathétique? Mais comment pouvez-vous appeler un homme qui, à 18 ans, est devenu le premier champion du monde d'échecs parmi les jeunes hommes d'Asie, et à dix-neuf ans – le premier grand maître de l'histoire de son pays? Ce fut le début de la voie du champion d'échecs –Viswanathan Anand – l'homme qui a inscrit son nom à jamais dans l'histoire des échecs du monde. Une autre légende dans l'équipe d'InstaSpot!


Le FC Borussia est l'un des clubs de football les plus titrés d'Allemagne, qui a prouvé à maintes reprises à ses fans que l'esprit de rivalité et de leadership mènera certainement au succès. Négociez de la même manière que les professionnels du sport mènent le jeu: en toute confiance et activement. Devenez un leader avec le FC Borussia et soyez en tête avec l'équipe InstaSpot!
The economic calendar commonly lacks high-impact economic data on Monday. Yesterday was no exception. The US, the UK, and the EU did not release any economic reports.
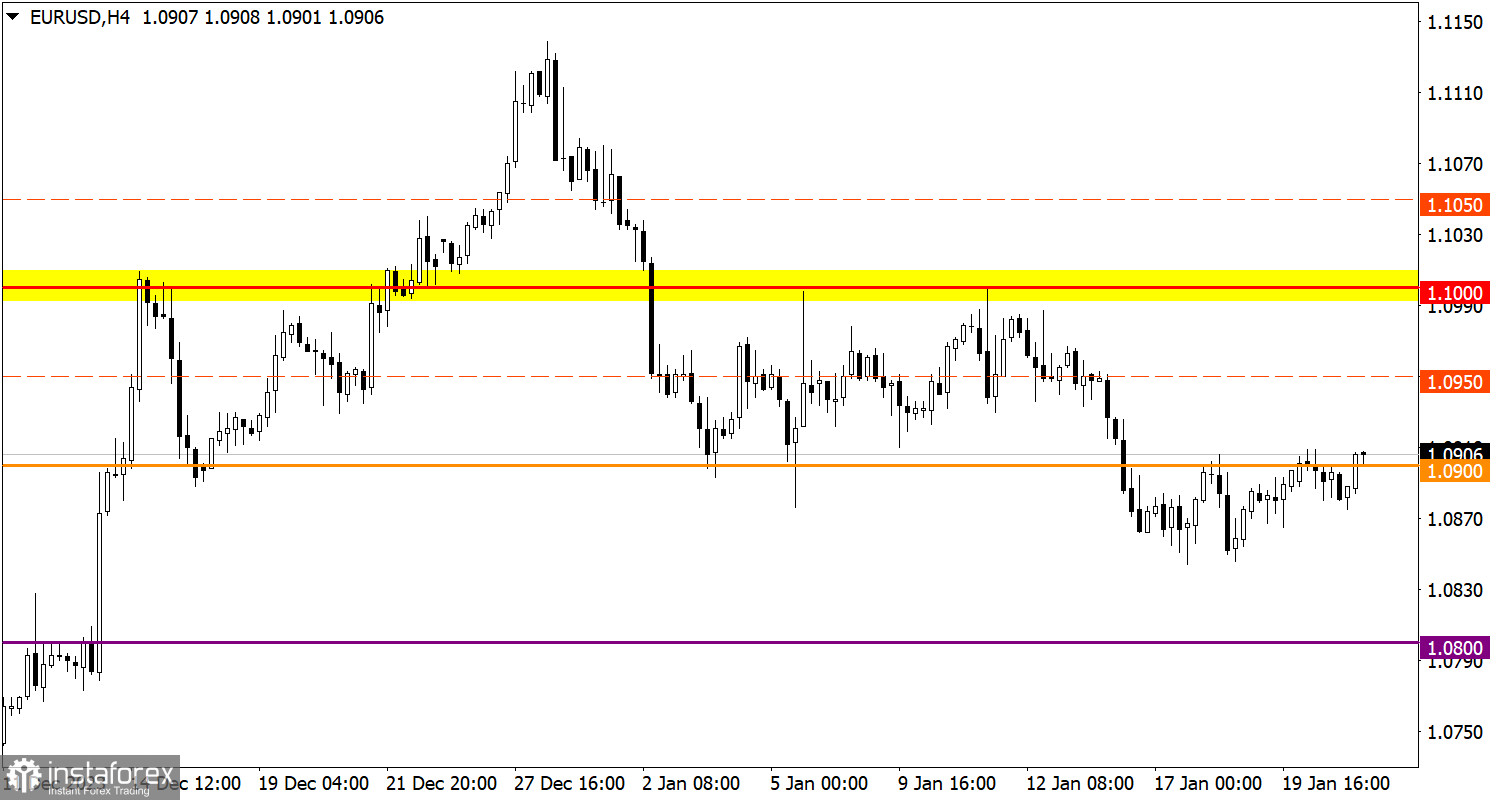
The EUR/USD pair has been moving around the 1.0900 level for the third day in a row with low trading activity. The level of 1.0850 serves as a variable support on the path of sellers. At this level, there was a reduction in short positions on EUR/USD.
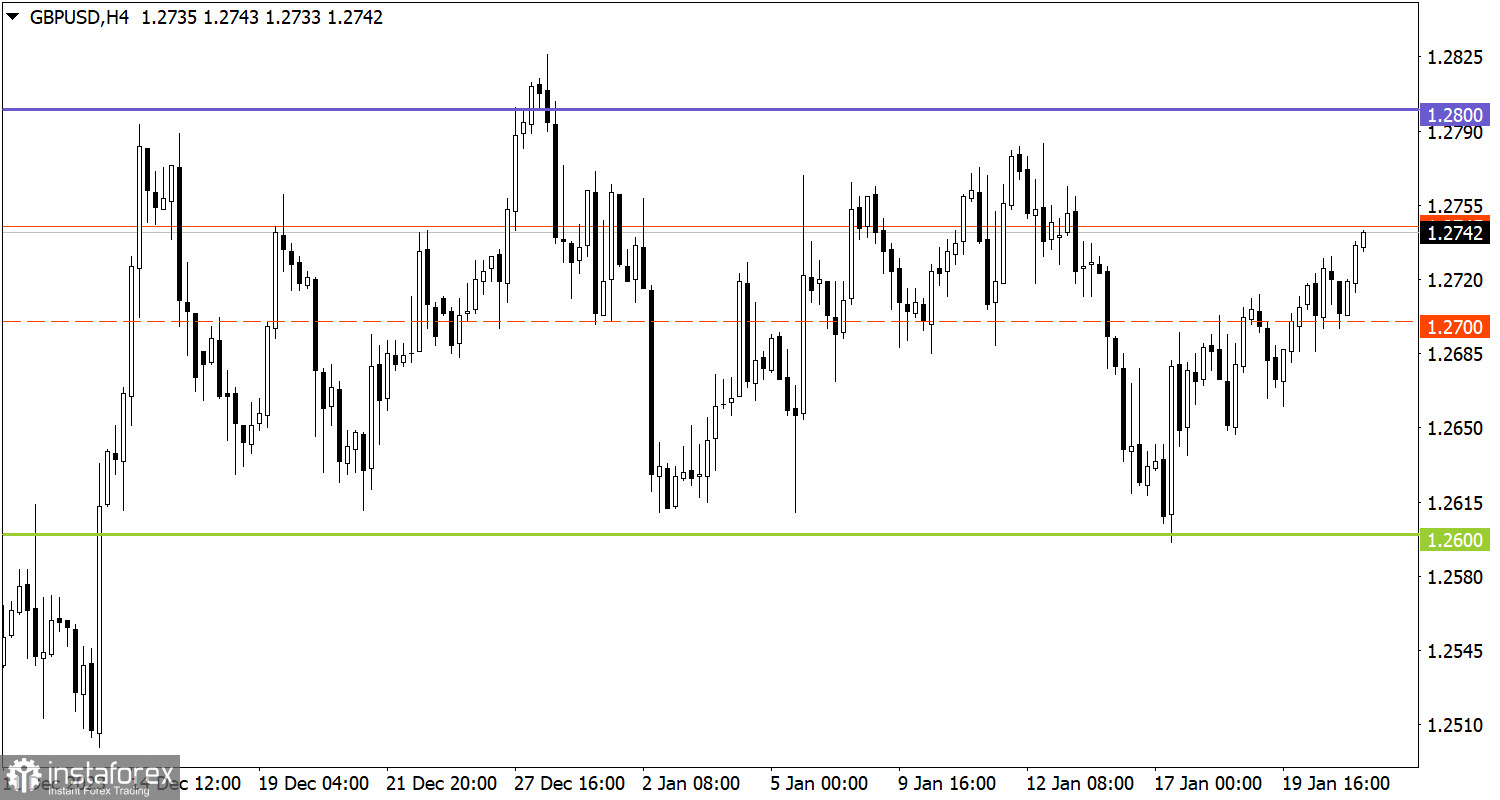
The GBP/USD currency pair is trading within the sideways channel of 1.2600/1.2800, consistently approaching the defined borders. At the moment, we see the consolidation above the average level of 1.2700, which indicates an increase in long positions on the range-bound market.

Today the economic calendar is equally empty as on Monday. No macroeconomic data will be released in the US, the UK, and the EU.
Consolidation of the price above 1.0900 during the day may lead to an increase in the volume of long positions in the direction towards 1.1000. As for the bearish scenario, it will come into play if the price drops below 1.0850.
In this situation, we may go ahead trading within the borders of the sideways channel. We reckon the instrument could approach the upper border at 1.2800.
However, we should not forget that the range-bound market is a temporary pattern, which leads to the accumulation of trading forces and abundant attention from speculators. As a result, the instrument will gain a certain momentum and break any of the borders. When the flat market is over, the price will indicate a further direction in the market. For this reason, you should always consider the breakout strategy.
The candlestick chart type consists of graphic rectangles in white and black with lines at the top and bottom. With a detailed analysis of each individual candle, you can see its characteristics relative to a particular time frame: opening price, closing price, maximum and minimum price.
Horizontal levels are price coordinates relative to which a price may stop or revered its trajectory. In the market, these levels are called support and resistance.
Circles and rectangles are highlighted examples where the price developed. This color highlighting indicates horizontal lines that may put pressure on the price in the future.
Up/down arrows are guidelines for possible price direction in the future.
*The market analysis posted here is meant to increase your awareness, but not to give instructions to make a trade.
InstaSpot analytical reviews will make you fully aware of market trends! Being an InstaSpot client, you are provided with a large number of free services for efficient trading.


