


Τα μοτίβα είναι γραφικά μοντέλα που σχηματίζονται στο γράφημα από την τιμή. Σύμφωνα με ένα από τα αξιώματα τεχνικής ανάλυσης, η ιστορία (μεταβολή των τιμών) επαναλαμβάνεται. Αυτό σημαίνει ότι οι μεταβολές των τιμών είναι συχνά παρόμοιες στις ίδιες καταστάσεις που καθιστούν δυνατή την πρόβλεψη της περαιτέρω εξέλιξης της κατάστασης με μεγάλη πιθανότητα.
Σχετικά μοτίβα από την InstaSpot είναι μια εύχρηστη υπηρεσία που σας επιτρέπει να γνωρίζετε τις τελευταίες αλλαγές στην αγορά και να αντιδράτε σε ενδείξεις από την αγορά στον χρόνο. Στην υπηρεσία μας θα βρείτε πάντα τα πιο πρόσφατα και πιο σχετικά μοτίβα σε οποιοδήποτε ζεύγος και οποιοδήποτε χρονικό πλαίσιο.
Bearish Symmetrical Triangle
was formed on 21.03 at 10:30:41 (UTC+0)
signal strength 3 of 5
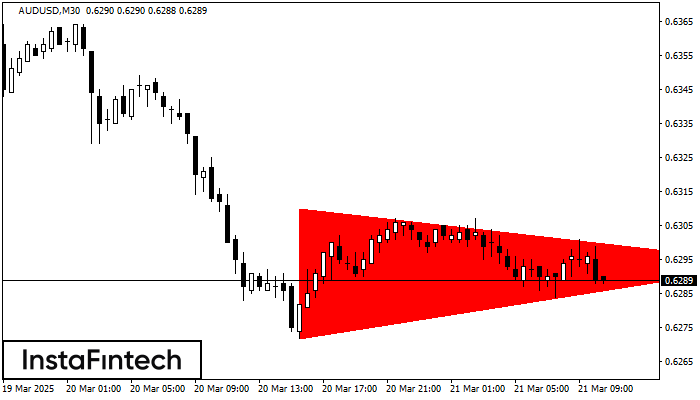
According to the chart of M30, AUDUSD formed the Bearish Symmetrical Triangle pattern. Description: The lower border is 0.6272/0.6294 and upper border is 0.6310/0.6294. The pattern width is measured on the chart at -38 pips. The formation of the Bearish Symmetrical Triangle pattern evidently signals a continuation of the downward trend. In other words, if the scenario comes true and AUDUSD breaches the lower border, the price could continue its move toward 0.6264.

