


Τα μοτίβα είναι γραφικά μοντέλα που σχηματίζονται στο γράφημα από την τιμή. Σύμφωνα με ένα από τα αξιώματα τεχνικής ανάλυσης, η ιστορία (μεταβολή των τιμών) επαναλαμβάνεται. Αυτό σημαίνει ότι οι μεταβολές των τιμών είναι συχνά παρόμοιες στις ίδιες καταστάσεις που καθιστούν δυνατή την πρόβλεψη της περαιτέρω εξέλιξης της κατάστασης με μεγάλη πιθανότητα.
Σχετικά μοτίβα από την InstaSpot είναι μια εύχρηστη υπηρεσία που σας επιτρέπει να γνωρίζετε τις τελευταίες αλλαγές στην αγορά και να αντιδράτε σε ενδείξεις από την αγορά στον χρόνο. Στην υπηρεσία μας θα βρείτε πάντα τα πιο πρόσφατα και πιο σχετικά μοτίβα σε οποιοδήποτε ζεύγος και οποιοδήποτε χρονικό πλαίσιο.
Triple Bottom
was formed on 26.03 at 07:00:22 (UTC+0)
signal strength 3 of 5
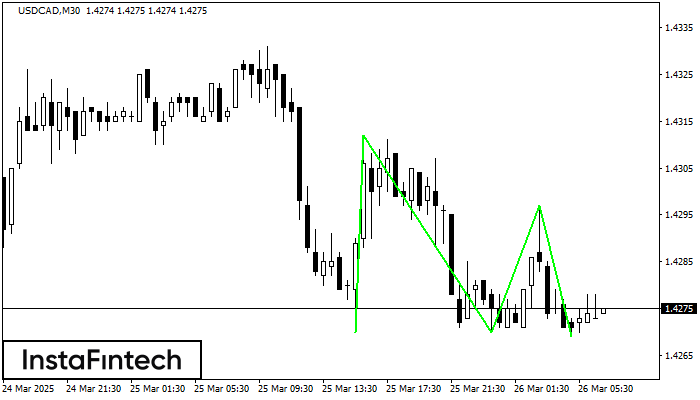
The Triple Bottom pattern has formed on the chart of USDCAD M30. Features of the pattern: The lower line of the pattern has coordinates 1.4312 with the upper limit 1.4312/1.4297, the projection of the width is 42 points. The formation of the Triple Bottom pattern most likely indicates a change in the trend from downward to upward. This means that in the event of a breakdown of the resistance level 1.4270, the price is most likely to continue the upward movement.

