


Πραγματικά μοτίβα

Τα μοτίβα είναι γραφικά μοντέλα που σχηματίζονται στο γράφημα από την τιμή. Σύμφωνα με ένα από τα αξιώματα τεχνικής ανάλυσης, η ιστορία (μεταβολή των τιμών) επαναλαμβάνεται. Αυτό σημαίνει ότι οι μεταβολές των τιμών είναι συχνά παρόμοιες στις ίδιες καταστάσεις που καθιστούν δυνατή την πρόβλεψη της περαιτέρω εξέλιξης της κατάστασης με μεγάλη πιθανότητα.
Σχετικά μοτίβα από την InstaSpot είναι μια εύχρηστη υπηρεσία που σας επιτρέπει να γνωρίζετε τις τελευταίες αλλαγές στην αγορά και να αντιδράτε σε ενδείξεις από την αγορά στον χρόνο. Στην υπηρεσία μας θα βρείτε πάντα τα πιο πρόσφατα και πιο σχετικά μοτίβα σε οποιοδήποτε ζεύγος και οποιοδήποτε χρονικό πλαίσιο.
Bearish Symmetrical Triangle
was formed on 01.04 at 09:09:30 (UTC+0)
signal strength 3 of 5
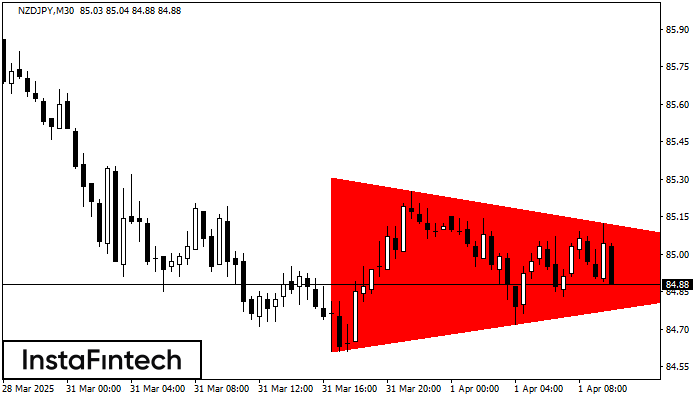
According to the chart of M30, NZDJPY formed the Bearish Symmetrical Triangle pattern. This pattern signals a further downward trend in case the lower border 84.61 is breached. Here, a hypothetical profit will equal the width of the available pattern that is -69 pips.
- All
- All
- Bullish Rectangle
- Bullish Symmetrical Triangle
- Bullish Symmetrical Triangle
- Double Bottom
- Double Top
- Double Top
- Triple Top
- Triple Top
- Triple Top
- Triple Top
- All
- All
- Buy
- Sale
- All
- 1
- 2
- 3
- 4
- 5
Bullish pennant
was formed on 21.04 at 07:00:12 (UTC+0)
signal strength 3 of 5

The Bullish pennant graphic pattern has formed on the NZDCAD M30 instrument. This pattern type falls under the category of continuation patterns. In this case, if the quote can breaks
Open chart in a new window
Bullish Rectangle
was formed on 21.04 at 06:10:19 (UTC+0)
signal strength 1 of 5

According to the chart of M5, #Bitcoin formed the Bullish Rectangle which is a pattern of a trend continuation. The pattern is contained within the following borders: the lower border
The M5 and M15 time frames may have more false entry points.
Open chart in a new window
Double Bottom
was formed on 21.04 at 06:05:07 (UTC+0)
signal strength 1 of 5

The Double Bottom pattern has been formed on USDJPY M5. This formation signals a reversal of the trend from downwards to upwards. The signal is that a buy trade should
The M5 and M15 time frames may have more false entry points.
Open chart in a new window
