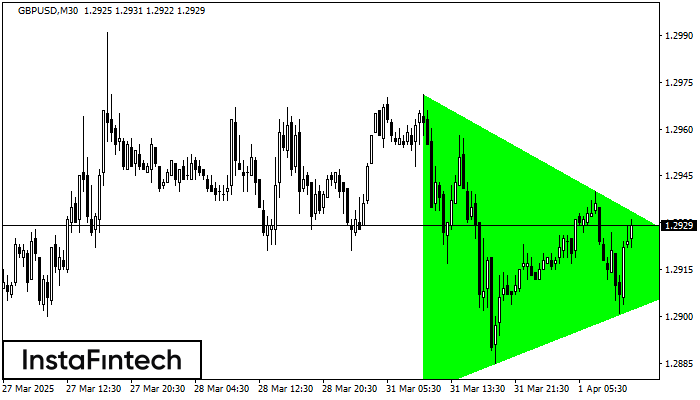
Bullish Symmetrical Triangle
was formed on 01.04 at 11:03:47 (UTC+0)
signal strength 3 of 5

According to the chart of M30, GBPUSD formed the Bullish Symmetrical Triangle pattern. The lower border of the pattern touches the coordinates 1.2876/1.2915 whereas the upper border goes across 1.2971/1.2915. If the Bullish Symmetrical Triangle pattern is in progress, this evidently signals a further upward trend. In other words, in case the scenario comes true, the price of GBPUSD will breach the upper border to head for 1.2945.
See Also
- All
- All
- Bullish Rectangle
- Bullish Symmetrical Triangle
- Bullish Symmetrical Triangle
- Double Bottom
- Double Top
- Double Top
- Triple Top
- Triple Top
- Triple Top
- Triple Top
- All
- All
- Buy
- Sale
- All
- 1
- 2
- 3
- 4
- 5
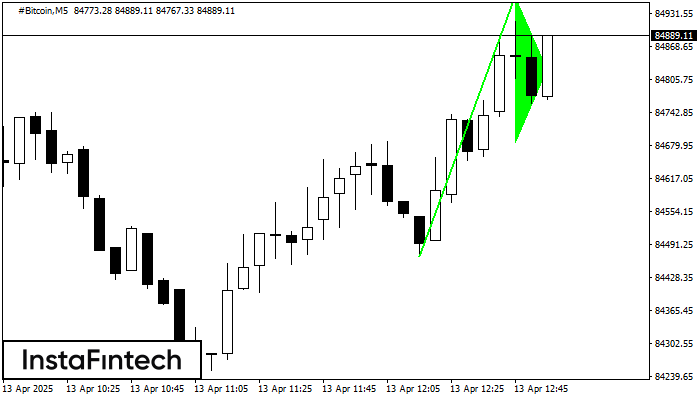
Gagliardetto Rialzista
was formed on 13.04 at 11:56:52 (UTC+0)
signal strength 1 of 5
Il segnale Gagliardetto Rialzista – Strumento di trading #Bitcoin M5, modello di continuazione. Previsione: è possibile impostare una posizione di acquisto al di sopra del massimo di 84963.00
I time frame M5 e M15 possono avere più punti di ingresso falsi.
Open chart in a new window
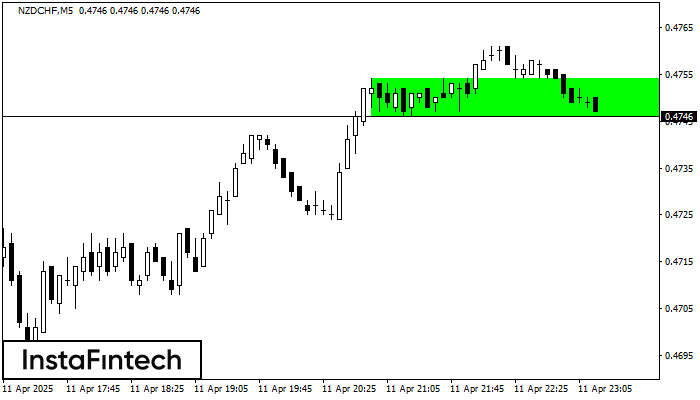
Rettangolo Rialzista
was formed on 11.04 at 22:20:31 (UTC+0)
signal strength 1 of 5
Secondo il grafico di M5, NZDCHF ha formato il Rettangolo Rialzista. Il modello indica una continuazione di trend. Il confine superiore è 0.4754, il confine inferiore è 0.4746. Il segnale
I time frame M5 e M15 possono avere più punti di ingresso falsi.
Open chart in a new window
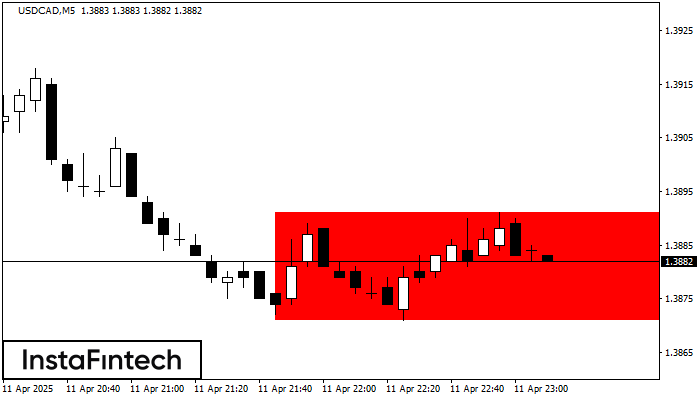
Rettangolo Ribassista
was formed on 11.04 at 22:10:27 (UTC+0)
signal strength 1 of 5
Secondo il grafico di M5, USDCAD ha formato il Rettangolo Ribassista che è un modello di una continuazione di trend. Il modello è contenuto entro i seguenti confini: il confine
I time frame M5 e M15 possono avere più punti di ingresso falsi.
Open chart in a new window


